

Technical Reference
Overview
The ENERGY STAR Score for Bank Branches in Canada applies to commercial banking outlets that offer banking services to walk-in customers. The objective of the ENERGY STAR score is to fairly assess how a property’s energy use measures up against similar properties considering the climate, weather, and business activities. A statistical analysis of the peer building population is performed to identify the aspects of property activity that are significant drivers of energy use and to normalize for those same factors. The result of this analysis is an equation that predicts the energy use of a property, based on its business activities. This prediction is compared to the property’s actual energy use to yield a 1 – 100 percentile ranking in relation to the national population of properties.
- Property types. The ENERGY STAR score for Bank Branches in Canada applies to commercial banking outlets that offer banking services to walk-in customers. The ENERGY STAR score applies to individual buildings only and is not available for campuses.
- Reference data. The analysis for bank branches in Canada is based on data from the Survey of Commercial and Institutional Energy Use (SCIEU), which was commissioned by Natural Resources Canada (NRCan) and carried out by Statistics Canada and represents the energy consumption year 2019.
- Adjustments for weather and business activity. The analysis includes adjustments for:
- Worker Density
- Weather and Climate (using Heating and Cooling Degree Days, retrieved based on postal code)
- Percent of the Building that is Cooled and Heated
- Release date. August 2023 is the original release date of the ENERGY STAR score for Bank Branches in Canada.
This document details the calculation of the 1 – 100 ENERGY STAR score for Bank Branches. For more information on the methodology used to set up ENERGY STAR scores, go to the Technical Reference for the ENERGY STAR Score (PDF, 709 KB).
The following sections explain how the ENERGY STAR score for Bank Branches is developed:
- Overview
- Reference data & filters
- Variables analysed
- Regression equation results
- Energy star score lookup table
- Example calculation
Reference data & filters
The reference data used to form the peer property population relies on the Survey on Commercial and Institutional Energy Use (SCIEU), which was commissioned by Natural Resources Canada and conducted by Statistics Canada. The energy data for the survey was from the calendar year 2019. The raw data file for this survey is not publicly available, but a report providing summary results will be available on Natural Resources Canada’s website at National Energy Use Database.
Four types of filters are applied to analyse the building energy and operating characteristics in the survey. They are set to define the peer group for comparison and to overcome any technical limitations. Those filters are: Building Type Filters, Program Filters, Data Limitation Filters, and Analytical Filters.
A complete description of each category is given in the Technical Reference for the ENERGY STAR Score (PDF, 709 KB). Figure 1 summarizes each filter used to develop the ENERGY STAR score for Bank Branch model and the rationale that supports the filter. After all filters are applied, the remaining data set has 138 observations. Due to the confidentiality of the survey data, NRCan is not able to identify the number of cases after each filter.
| Condition for Including an Observation in the Analysis | Rationale |
|---|---|
| Defined as Bank Branch in SCIEU2019 | The SCIEU survey covered the commercial and institutional sector and included buildings of all types. For this model, only the observations identified as primarily Bank Branch are used. |
| Must be more than 50% Bank Branch and less than 50% of any other building type | Building Type Filter – To be considered as a Bank Branch, the building must have a minimum amount of Bank Branch space. |
| Must have electricity consumption data | Program Filter –bank branches that do not use electricity are rare or non-existent and may indicate an omission in energy data. Electricity can be grid-purchased or produced on site. |
| Must be built in 2018 or earlier | Data Limitation Filter – The survey reported the energy consumption data for calendar year 2019. Therefore, if the building was being built in 2019, a full year of energy data would not be available. |
| Must not include energy supplied to other buildings | Data Limitation Filter – The survey asked whether the energy reported at the facility included energy supplied to other buildings such as a multi-building complex or portables. Usage data may not have been included; therefore, buildings were removed. |
| The area of the indoor or partially enclosed parking structures must be less than 50% of the gross floor area including indoor and partially enclosed parking structures | Program Filter – If the combined area of parking structures is more than 50% the area of the Bank Branch building, the overall structure is classified as a parking structure, not as a bank branch. |
| The size of the vacant space must be less than 50% of the gross floor area | Program Filter – Occupancy needs to be greater than 50% for Bank Branch to meet ENERGY STAR certification requirements. |
| More than 50% of the building must be heated | Program Filter – More than 50% of a bank branch must be heated for it to be considered a Bank Branch. |
| Must operate for at least 10 months | Program Filter – Must operate for at least 10 months for Bank Branch to meet ENERGY STAR certification requirements. |
| Must be at least 92.9 m2 | Program Filter – To be considered as a bank branch, buildings must be at least 92.9 m2 (1,000 sq. ft.) in Canada. |
| Must operate for at least 30 hours and less than 168 hours per week | Program Filter – To be considered as a bank branch, buildings must operate for at least one hour and less than 168 hours per week. |
| Must have at least one worker | Program Filter – To be considered as a bank branch, buildings must have at least one worker. |
| Must have at least one computer | Program Filter – To be considered as a bank branch, buildings must have at least one computer. |
| Must have worker density less than or equal to 5 workers per 100 m2 | Analytical Filter – Values determined to be outliers based on analysis of the data. Outliers are typically clearly outside normal operating parameters for a building of this type. |
| Source EUI must be higher than 0.15 and lower or equal to 4.0 GJ/m2 | Analytical Filter – Values determined to be outliers based on analysis of the data. Outliers are typically clearly outside normal operating parameters for a building of this type. |
Of the filters applied to the reference data, some result in constraints on calculating a score in Portfolio Manager, and others do not. Building Type and Program Filters are used to limit the reference data to include only properties that are intended to receive a score in Portfolio Manager and are therefore related to eligibility requirements. In contrast, Data Limitation Filters account for limitations in the data available during the analysis, but do not apply in Portfolio Manager. Analytical Filters are used to eliminate outlier data points or different subsets of data and may or may not affect eligibility. A full description of the criteria you must meet to obtain a score in Portfolio Manager is available at Benchmarking - Frequently Asked Questions.
Related to the filters and eligibility criteria described above, another consideration is how Portfolio Manager treats properties situated on a campus. The main unit for benchmarking in Portfolio Manager is the property, which may be used to describe either a single building or campus of buildings. The applicability of the ENERGY STAR score depends on the type of property. For bank branches, the score is based on individual buildings, because the primary function of the bank branches is contained within a single building and because the properties included in the reference data are single buildings. In cases where multiple bank branches are situated together (e.g., a bank branch campus), each individual building can receive its own ENERGY STAR score, but the campus cannot earn a score.
Variables analysed
To normalize for differences in business activity, NRCan performed a statistical analysis to understand what aspects of building activity are significant with respect to energy use. The filtered reference data set, described in the previous section, was analysed using a weighted ordinary least squares regression, which evaluated energy use relative to business activity (e.g. number of workers, operating hours per week, floor area, and climate).This linear regression gave an equation used to compute energy use (also called the dependent variable) based on a series of characteristics that describe the business activities (also called independent variables). This section details the variables used in the statistical analysis for Bank Branches in Canada.
Dependent Variables
The dependent variable is what NRCan tries to predict with the regression equation. For the Bank Branch analysis, the dependent variable is energy use, expressed in source energy use intensity (source EUI). This is equal to the total source energy use of the property divided by the gross floor area. The regression analyzes the key drivers of source EUI—those factors that explain the variation in source energy use per square metre in Bank Branches. The units for source EUI in the Canadian model are annual gigajoules per square metre (GJ/m2).
Independent Variables
The reference survey contains numerous property operation questions that NRCan identified as likely to be important for Bank Branches. Based on a review of the variables found in the reference data, following the criteria for inclusion in Portfolio Manager,Footnote 1 NRCan initially analysed the variables below in the regression analysis:
- Gross floor area (m2)
- Cooling degree days (CDD)
- Heating degree days (HDD)
- Percentage of floor space that is cooled
- Percentage of floor space that is heated
- Weekly hours of operation
- Number of workers during the main shift
- Number of computers
- Months in operation in 2019
- Number of domestic appliances
- Number of commercial appliances
- Number of electronic displays
- Year of construction
NRCan, with the advice of the Environmental Protection Agency (EPA) and its contractor, performed an extensive review on all of these operational characteristics individually and in combination with each other (e.g., Heating Degree Days times Percent Heated). As part of the analysis, some variables were reformatted to reflect the physical relationships of building components. For example, the number of workers can be evaluated in a density format: workers per 100 m2. Overall, the analysis consists of multiple regression formulations, structured to find the combination of statistically significant operating characteristics that explained the greatest amount of variance in the dependent variable: source EUI.
The final regression equation includes the following variables:
- Number of Workers on Main Shift per 100 m2 (Worker Density)
- Percent Cooled x Cooling Degree Days (Percent Cooled x CDD)
- Percent Heated x Heating Degree Days (Percent Heated x HDD)
These variables are used together to compute the predicted source EUI for Bank Branches. The predicted source EUI is the mean EUI for a hypothetical population of buildings that share the same values for each of these characteristics. It is the mean energy for buildings that operate like your building.
Testing
NRCan further analysed the regression equation using actual data entered in Portfolio Manager. In addition to the SCIEU data, this analysis provided another set of buildings to examine the ENERGY STAR scores and distributions to assess the impacts and adjustments. It also confirmed that there are minimal biases when it comes to fundamental operational characteristics, such as percent cooled or percent heated, and that there was no regional bias or bias for the type of energy used for heating.
It is important to reiterate that the final regression equation relies on the nationally representative reference data from SCIEU 2019, and not on data previously stored in Portfolio Manager.
Regression equation results
The final regression is a weighted ordinary least squares regression across the filtered data set of 380 observations. The dependent variable is source EUI. Each independent variable is centred relative to the weighted mean value, presented in Figure 2. The final equation is presented in Figure 3. All variables in the regression equation are considered significant at a 90% confidence level or better, as shown by their respective significance levels.
The regression equation has a coefficient of determination (R2) value of 0.2267, indicating that this equation explains 22.67% of the variance in source EUI for Bank Branches. Because the final equation is structured with energy per unit area as the dependent variable, the explanatory power of the area is not included in the R2 value, and thus this value appears artificially low. Recomputing the R2 value in units of source energyFootnote 2 demonstrates that the equation explains 95.88% of the variation in total source energy of Bank Branches. It is an excellent result for a statistically based energy model.
For detailed information on the ordinary least squares regression approach, see the Technical Reference for the ENERGY STAR Score (PDF, 709 KB).
| Variable | Minimum | Median | Maximum | Mean |
|---|---|---|---|---|
| Source energy per square metre (GJ/m2) | 0.1938 | 1.482 | 3.216 | 1.482 |
| Number of Workers per 100 m2 | 0.2319 | 2.445 | 4.784 | 2.445 |
| Percent Cooled x CDD | 0.000 | 221.0 | 389.0 | 221.0 |
| Percent Heated x HDD | 2677 | 3964 | 6916 | 3964 |
Figure 3 – Final Regression Results
| Dependent variable | Source energy use intensity (GJ/m2) |
|---|---|
| Number of observations in analysis | 138 |
| R2 value | 0.2267 |
| Adjusted R2 value | 0.2094 |
| F statistic | 13.1 |
| Significance (p-level) | <0.0001 |
| Dependent variable | Unstandardized Coefficients | Standard Error | T Value | Significance |
| Constant | 1.509 | 4.365E-02 | 34.56 | <.0001 |
| Number of Workers per 100 m2 | 0.1874 | 5.554E-02 | 3.37 | 0.001 |
| Percent Cooled x CDD | 2.052E-03 | 5.889E-05 | 4.07 | <.0001 |
| Percent Heated x HDD | 2.395E-04 | 4.487E-04 | 4.57 | <.0001 |
Notes:
|
||||
Energy star score lookup table
The final regression equation (presented in Figure 3) gives a prediction of source EUI based on a building’s operating characteristics. Some buildings in the SCIEU data sample use more energy than predicted by the regression equation, while others use less. The actual source EUI of each reference data observation is divided by its predicted source EUI to calculate an energy efficiency ratio:
An efficiency ratio lower than one indicates that a building uses less energy than predicted, and consequently is more efficient. A higher efficiency ratio indicates the opposite.
The efficiency ratios are sorted from smallest to largest, and the cumulative percent of the population at each ratio is computed using the individual observation weights from the reference data set. Figure 4 presents a plot of this cumulative distribution. A smooth curve (shown in orange) is fitted to the data using a two-parameter gamma distribution. The fit is performed to minimize the sum of squared differences between each building’s actual percent rank in the group and each building’s percent rank with the gamma solution. The final fit for the gamma curve gave a shape parameter (alpha) of 11.45 and a scale parameter (beta) of 0.08973. The sum of the squared error for this fit is 0.1817.
Figure 4 – Distribution for Bank Branches
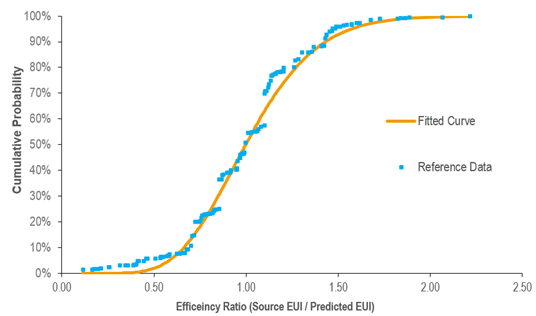
The final gamma shape and scale parameters are used to calculate the efficiency ratio at each percentile (1 to 100) along the curve. For example, the ratio on the gamma curve at 1% corresponds to a score of 99; only 1% of the population has a ratio this small or smaller. The ratio on the gamma curve at the value of 25% corresponds to the ratio for a score of 75; only 25% of the population has a ratio this small or smaller. Figure 5 shows the complete score lookup table.
Figure 5 – ENERGY STAR Score Lookup Table for Bank Branches
| ENERG STAR Score | Cumulative Percentage | Energy Efficiency Ratio | |
|---|---|---|---|
| > = | < | ||
| 100 | 0% | 0.0000 | 0.4542 |
| 99 | 1% | 0.4542 | 0.5033 |
| 98 | 2% | 0.5033 | 0.5362 |
| 97 | 3% | 0.5362 | 0.5620 |
| 96 | 4% | 0.5620 | 0.5836 |
| 95 | 5% | 0.5836 | 0.6025 |
| 94 | 6% | 0.6025 | 0.6193 |
| 93 | 7% | 0.6193 | 0.6347 |
| 92 | 8% | 0.6347 | 0.6489 |
| 91 | 9% | 0.6489 | 0.6622 |
| 90 | 10% | 0.6622 | 0.6747 |
| 89 | 11% | 0.6747 | 0.6866 |
| 88 | 12% | 0.6866 | 0.6979 |
| 87 | 13% | 0.6979 | 0.7088 |
| 86 | 14% | 0.7088 | 0.7192 |
| 85 | 15% | 0.7192 | 0.7293 |
| 84 | 16% | 0.7293 | 0.7391 |
| 83 | 17% | 0.7391 | 0.7485 |
| 82 | 18% | 0.7485 | 0.7578 |
| 81 | 19% | 0.7578 | 0.7668 |
| 80 | 20% | 0.7668 | 0.7756 |
| 79 | 21% | 0.7756 | 0.7843 |
| 78 | 22% | 0.7843 | 0.7928 |
| 77 | 23% | 0.7928 | 0.8011 |
| 76 | 24% | 0.8011 | 0.8094 |
| 75 | 25% | 0.8094 | 0.8175 |
| 74 | 26% | 0.8175 | 0.8254 |
| 73 | 27% | 0.8254 | 0.8333 |
| 72 | 28% | 0.8333 | 0.8412 |
| 71 | 29% | 0.8412 | 0.8489 |
| 70 | 30% | 0.8489 | 0.8566 |
| 69 | 31% | 0.8566 | 0.8642 |
| 68 | 32% | 0.8642 | 0.8717 |
| 67 | 33% | 0.8717 | 0.8792 |
| 66 | 34% | 0.8792 | 0.8867 |
| 65 | 35% | 0.8867 | 0.8941 |
| 64 | 36% | 0.8941 | 0.9015 |
| 63 | 37% | 0.9015 | 0.9089 |
| 62 | 38% | 0.9089 | 0.9162 |
| 61 | 39% | 0.9162 | 0.9236 |
| 60 | 40% | 0.9236 | 0.9309 |
| 59 | 41% | 0.9309 | 0.9382 |
| 58 | 42% | 0.9382 | 0.9456 |
| 57 | 43% | 0.9456 | 0.9529 |
| 56 | 44% | 0.9529 | 0.9602 |
| 55 | 45% | 0.9602 | 0.9676 |
| 54 | 46% | 0.9676 | 0.9750 |
| 53 | 47% | 0.9750 | 0.9824 |
| 52 | 48% | 0.9824 | 0.9898 |
| 51 | 49% | 0.9898 | 0.9973 |
| ENERGY STAR Score | Cumulative Percentage | Energy Efficiency Ratio | |
|---|---|---|---|
| >= | < | ||
| 50 | 50% | 0.9973 | 1.0048 |
| 49 | 51% | 1.0048 | 1.0123 |
| 48 | 52% | 1.0123 | 1.0199 |
| 47 | 53% | 1.0199 | 1.0275 |
| 46 | 54% | 1.0275 | 1.0352 |
| 45 | 55% | 1.0352 | 1.0430 |
| 44 | 56% | 1.0430 | 1.0508 |
| 43 | 57% | 1.0508 | 1.0587 |
| 42 | 58% | 1.0587 | 1.0667 |
| 41 | 59% | 1.0667 | 1.0748 |
| 40 | 60% | 1.0748 | 1.0830 |
| 39 | 61% | 1.0830 | 1.0912 |
| 38 | 62% | 1.0912 | 1.0996 |
| 37 | 63% | 1.0996 | 1.1081 |
| 36 | 64% | 1.1081 | 1.1167 |
| 35 | 65% | 1.1167 | 1.1255 |
| 34 | 66% | 1.1255 | 1.1344 |
| 33 | 67% | 1.1344 | 1.1434 |
| 32 | 68% | 1.1434 | 1.1527 |
| 31 | 69% | 1.1527 | 1.1621 |
| 30 | 70% | 1.1621 | 1.1717 |
| 29 | 71% | 1.1717 | 1.1815 |
| 28 | 72% | 1.1815 | 1.1915 |
| 27 | 73% | 1.1915 | 1.2018 |
| 26 | 74% | 1.2018 | 1.2123 |
| 25 | 75% | 1.2123 | 1.2232 |
| 24 | 76% | 1.2232 | 1.2343 |
| 23 | 77% | 1.2343 | 1.2458 |
| 22 | 78% | 1.2458 | 1.2577 |
| 21 | 79% | 1.2577 | 1.2700 |
| 20 | 80% | 1.2700 | 1.2827 |
| 19 | 81% | 1.2827 | 1.2960 |
| 18 | 82% | 1.2960 | 1.3098 |
| 17 | 83% | 1.3098 | 1.3242 |
| 16 | 84% | 1.3242 | 1.3394 |
| 15 | 85% | 1.3394 | 1.3554 |
| 14 | 86% | 1.3554 | 1.3723 |
| 13 | 87% | 1.3723 | 1.3902 |
| 12 | 88% | 1.3902 | 1.4095 |
| 11 | 89% | 1.4095 | 1.4302 |
| 10 | 90% | 1.4302 | 1.4527 |
| 9 | 91% | 1.4527 | 1.4774 |
| 8 | 92% | 1.4774 | 1.5049 |
| 7 | 93% | 1.5049 | 1.5360 |
| 6 | 94% | 1.5360 | 1.5719 |
| 5 | 95% | 1.5719 | 1.6149 |
| 4 | 96% | 1.6149 | 1.6687 |
| 3 | 97% | 1.6687 | 1.7420 |
| 2 | 98% | 1.7420 | 1.8616 |
| 1 | 99% | 1.8616 | >1.8616 |
Example calculation
According to the Technical Reference for the ENERGY STAR Score (PDF, 709 KB), there are five steps to compute a score for Bank Branches. Below is a specific example:
1 User enters building data into Portfolio Manager
- 12 months of energy use information for all energy types (annual values, entered in monthly meter entries)
- Physical building information (size, location, etc.) and use details describing building activity (hours, etc.)
| Energy Data | Value |
|---|---|
| Electricity | 168,000 kWh |
| Natural gas | 9,600 m3 |
| Property Use Details | Value |
|---|---|
| Gross floor area (m2) | 1300 |
| Number of Full-time Workers on Main Shift | 24 |
| Percent Cooled | 100% |
| Percent Heated | 100% |
| CDD (provided by Portfolio Manager, based on postal code) | 113 |
| HDD (provided by Portfolio Manager, based on postal code) | 4,766 |
2 Portfolio Manager computes the actual source EUI
- Total energy consumption for each fuel is converted from billing units into site energy and source energy.
- Source energy values are added across all fuel types.
- Source energy is divided by gross floor area to determine actual source EUI.
| Fuel | Billing Units | Site GJ Multiplier | Site GJ | Source Multiplier | Source GJ |
|---|---|---|---|---|---|
| Electricity | 168,000 kWh | 3.600E-03 | 604.8 | 1.830 | 1107 |
| Natural gas | 9,600 m3 | 3.843E-02 | 368.9 | 1.060 | 391.1 |
| Total Source Energy (GJ) | 1498 | ||||
| Source EUI (GJ/m2) | 1.152 | ||||
3 Portfolio Manager computes the predicted source EUI
- Using the property use details from Step 1, Portfolio Manager computes each building variable value in the regression equation (determining the density as necessary).
- The centring values are subtracted to compute the centred variable for each operating parameter (e.g., actual building value minus reference centring value).
- The centred variables are multiplied by the coefficients from the Bank Branches regression equation to obtain a predicted source EUI.
| Variable | Actual Building Value | Reference Centring Value | Building Centred Variable | Coefficient | Coefficient x Centred Variable |
|---|---|---|---|---|---|
| Constant | - | - | - | 1.509 | 1.509 |
| Worker Density | 2 | 2.523 | -0.6770 | 0.1874 | -0.1268 |
| Percent Cooled x CDD | 113 | 186.1 | -73.10 | 2.052E-03 | -0.1500 |
| Percent Heated x HDD | 4766 | 3982 | 784.0 | 2.395 E-04 | 0.1878 |
| Predicted Source EUI (GJ/m2) | 1.420 | ||||
4 Portfolio Manager computes the energy efficiency ratio
- The ratio equals the actual source EUI (Step 2) divided by the predicted source EUI (Step 3).
- Ratio = 1.420 / 1.152 = 0.8114
5 Portfolio Manager uses the efficiency ratio to assign a score via a lookup table
- The ratio from Step 4 is used to identify the score from the lookup table.
- A ratio of 0.8114 is greater than 0.8094 and less than 0.8175.
- The ENERGY STAR score is 75.