
On this page
- Theme introduction
- Indicator: Forest area harvested
- Indicator: Forest regeneration
- Indicator: Volume harvested relative to the sustainable wood supply
- Sources and information
Theme introductionFootnote 1
Sustainable forest management (SFM) seeks to maintain and enhance the ecological, social and economic benefits of forests, ensuring their availability for present and future generations. Canada adheres to these principles in managing its forests. In 2022, about 669,000 ha of forest were harvested in Canada, representing roughly 0.2% of the total forested area. Over the past decade, the percentage harvested has always been lower than 0.4% of the managed forest area.
Ownership and management of Canada’s forests
Nearly 90% of Canada’s forests are publicly owned, being managed by provincial or territorial governments through their respective forestry laws. These forests are governed by various regulations and policies that align with SFM principles, particularly through ecosystem-based management planning.
Determining harvested volumes
Forest management is a multidisciplinary effort, involving ground surveys, remote sensing, and growth models to assess forest composition, age, structure, and growth rates. This information is used to calculate the sustainable volume of wood that can be harvested while maintaining ecosystem functions like carbon sequestration and wildlife habitats. Research is ongoing to develop continuous forest inventory frameworks, which aim to grow the current inventory based on the latest remote sensing technologies. Scientists are also incorporating climate factors into growth models to better understand and account for climate impacts on forest growth.
Forest management plans and strategies
Forest management plans define the current and desired conditions of forest lands, along with strategies to achieve sustainable management goals, considering biodiversity, climate change and natural disturbances such as pest outbreaks, and wildfires. Forest management plans are developed by registered professional foresters in compliance with laws and regulations of each province and territory. The planning process involves consultation with Indigenous Peoples and stakeholders, increasingly integrating Indigenous knowledge and traditional practices into decision-making.
Challenges and opportunities from climate change
Canadian forests face significant challenges from global climate change. Changing climate affects the ability of some tree species to regenerate and alters forest ecosystems. However, it also creates opportunities, making Canadian forests more hospitable for tree species, such as white oak, whose established ranges do not currently extend this far north. Assisted migration scenarios are being developed and tested to relocate tree species from their native climates to new areas projected to have similar conditions in the future, aiming to preserve ecosystem functions, productivity and health.
Enhancing forest productivity and adaptation
Depending on jurisdictions, natural regeneration is usually prioritized and plays a substantial role in forest renewal. In addition to managing forests to favour natural regeneration, planting new trees often results in higher productivity through tree-breeding programs and better use of available growing space. Tree planting, in combination with natural regeneration, also gives control over forest composition, enabling ecosystems to adapt to future climate conditions and global environmental changes. Researchers and practitioners are developing silviculture practices to address climate change and the associated increased disturbances risks including wildfires, drought, windthrow, parasitism and disease. Innovative Climate-Smart and FireSmart silviculture practices aim to support a sustainable forest-based bioeconomy, reduce carbon emissions and maintain resilient forest ecosystems.
Climate-Smart silviculture aims at practices that will:
- ensure healthy, resilient growing forests
- reduce emissions from the forest sector operations
- maximize storage and substitution with wood products
- protect stored forest carbon
In addition, fire-smart silviculture practices will contribute to mitigate the risks and impacts of wildland fires that affect communities and infrastructure.
Indicator: Forest area harvestedFootnote 2
Annual trends in forest area harvested on private and Crown land. This indicator is important for understanding the level of industrial activity in Canada’s forests and for assessing long-term sustainability of forests and the forest sector.
Indicator details
By tracking the total area harvested annually, it is possible to assess the level of industrial activity taking place in Canada’s forests. This measurement helps estimate the long-term sustainability of harvesting activities. During the last decade, the percentage of forest area harvested has always been lower than 0.4% relative to managed forest area and around 0.2% relative to the total forest area.
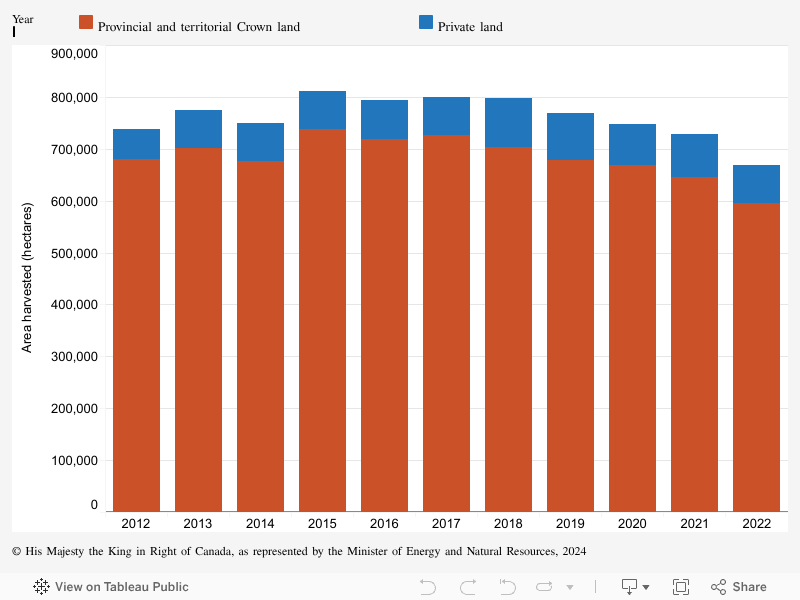
- In 2022, the area of forest harvested was estimated at nearly 669,000 ha. This is the lowest recorded level over the last ten years. It was a total drop of more than 8% compared to 2021, which is double the drop observed since the start of the pandemic in 2019.
- Greatest drops in area harvested were observed in British Columbia (-21%, 30,000 ha), New Brunswick (-15%, 11,800 ha) and Ontario (-8%, 9,400 ha).
- Among the many factors that contributed to this drop in harvests, in British Columbia there is a harvest drop in areas impacted by the mountain pine beetle and an increase in areas affected by forest fires.
- Across Canada, the rise in interest rates on mortgage payments, combined with significant fluctuations in lumber prices, have slowed down the residential construction market in North America, resulting in a drop in demand for wood products.
Why is this indicator important?
- Forest area harvested is one of the biggest indicators in terms of economic activity associated with the Canadian forestry sector.
- Areas harvested are generally correlated with the processed volume as well as the economic benefits of the forestry sector in communities that depend on it.
- Harvested area is a metric of human disturbance from natural resources development.
What is the outlook?
- Despite the end of the COVID-19 pandemic, employment in the forestry sector has dropped slightly compared to 2021, suggesting this industry is also being affected by the labour shortage. Such a drop in labour adds to the impact on the capacity to harvest in forests and explains the drop in forest area harvested.
- The price of softwood lumber should stabilize with the recovery in post-pandemic activities and increase demand for wood products and forest harvesting.
- Stabilized lumber prices and mortgage rates should help increase housing starts in the residential sector, which should stimulate forest harvesting.
How government initiatives support sustainable forest management
Each year, natural disturbances, such as pests and wildfires, impact the area available for harvest. These events are difficult to predict and forest managers must adjust their harvesting objectives in response to such events. However, there is support from multiple levels of government to assist in mitigating the impacts of wildfire and insect outbreaks while simultaneously creating economic opportunities for forestry and bioenergy production. One example is the Forests for Tomorrow (FFT) program, which is led by the Government of British Columbia. A second example is the federal government’s 2 Billion Trees (2BT) program, which supports reforestation efforts within wildfire-impacted areas.
Forest area harvested on private and Crown land in Canada, 2012-2022
Graph summary
Comparison of forest area harvested on Crown lands compared to private lands from 2012 to 2022.
Graph data
| Year | Area harvested (hectares) | |
|---|---|---|
| Provincial and territorial Crown land | Private land | |
| 2012 | 679,446 | 59,517 |
| 2013 | 701,957 | 73,184 |
| 2014 | 675,913 | 73,693 |
| 2015 | 738,316 | 72,296 |
| 2016 | 718,980 | 74,856 |
| 2017 | 726,398 | 73,123 |
| 2018 | 704,091 | 92,860 |
| 2019 | 677,572 | 92,058 |
| 2020 | 669,661 | 78,929 |
| 2021 | 645,704 | 83,266 |
| 2022 | 595,465 | 73,270 |
Indicator: Forest regenerationFootnote 3
Measure of area seeded, area planted, and number of seedlings planted on provincial and territorial Crown land. Monitoring regeneration activities ensures harvested areas regrow as forests and continue to produce timber and maintain ecosystem services.
Indicator details
In 2022, 423,000 ha of provincial forest lands in Canada were regenerated by planting and direct seeding. Of these lands, 98% were planted with 584 million seedlings, and 2% was regenerated with direct seeding.
- The area planted and the number of seedlings planted each declined by close to 15% in 2022 from highs reached in 2021, but the 2022 levels were only 4% lower than the 10-year average.
- Regionally, the largest decline in tree planting was in British Columbia. After 2020 and 2021, two years of record tree planting levels to aid in wildfire recovery, in 2022 tree planting declined to 2016 levels.
- Successful regeneration is required following forest harvesting on public lands.
- Forest type and silviculture system determine the regeneration method (natural or artificial).
- Artificial regeneration--planting or seeding--has been applied to 60% of the area harvested in the past 20 years.
- Wildfire recovery may be aided by artificial regeneration.
Why is this indicator important?
- Regeneration activities ensure that harvested areas, and sometimes those that experienced natural disturbances like wildfire and pests, regrow as forests and continue to produce timber and maintain ecosystem services, such as storing carbon, regulating water quality and providing habitat.
- The method used for regenerating forests can influence forest composition. Most artificial regeneration is for the establishment of coniferous trees, on appropriate sites and when natural regeneration is not successful, such as after a severe wildland fire disturbance.
What is the outlook?
- Regeneration rates are most strongly related to recent harvest levels. These levels are influenced by market conditions but are within the bounds of sustainable forest management.
- British Columbia accounts for nearly 50% of the national artificial regeneration activity in Canada. Due to the reduction of salvage operations in mountain pine beetle affected stands, harvest rates have declined and will likely reduce forestry-related tree planting in British Columbia. However, natural disturbances such as wildland fires also influence tree planting activities. Tree planting increased to record levels in 2020 and 2021 to help recover from the 2017 and 2018 wildland fires in the province. Levels then declined in 2022. Going forward, we can expect that spikes in tree planting may occur depending on the impact of future wildfire seasons. Nationally, there is likely going to be an increase in tree planting following the extreme fire season of 2023.
How government initiatives support sustainable forest management
- The 2 Billion Trees Program (2BT) will bolster the total area and number of seedlings planted across Canada, with efforts on public lands mostly related to reforestation following natural disturbances and forest restoration efforts.
- Since 2021, 2BT-funded projects have planted over 250 species at more than 4,482 sites across Canada. 92% of these projects planted more than 2 types of trees (see image below).
Tree diversity in the 2BT-funded plantation projects
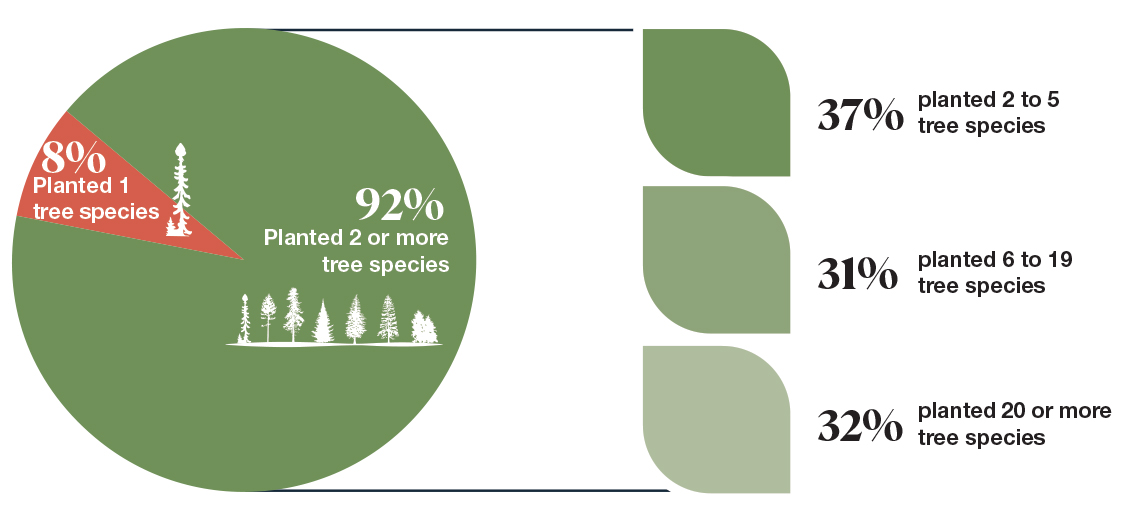
Graph summary
Infographic of a pie chart showing the percentage of projects funded by the 2 Billion Trees program that planted two or more tree species. The percentage of projects that planted two or more tree species is also broken down by the number of species planted.
Graph data
Percentage of 2 Billion Trees-funded projects according to the number of tree species planted.
| Number of tree species planted | Percentage of projects |
|---|---|
| 1 tree species | 8% |
| 2 or more tree species | 92% |
Breakdown of the number of tree species planted in 2 Billion Trees-funded projects that planted 2 or more species and percentage of projects in each category.
| Number of tree species planted | Percentage of projects |
|---|---|
| 2 to 5 tree species | 37% |
| 6 to 19 tree species | 31% |
| 20 or more tree species | 32% |
Area artificially regenerated and number of seedlings planted on provincial and territorial Crown lands in Canada, 2012-2022
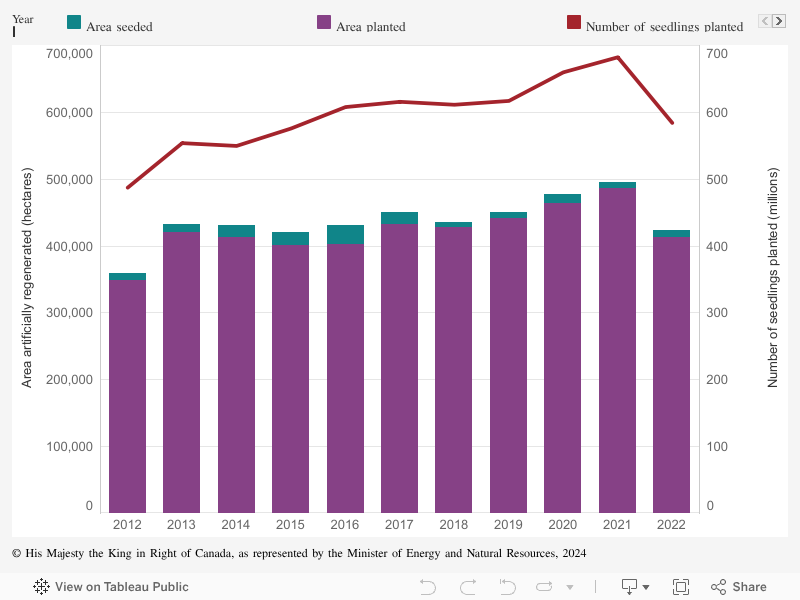
Graph summary
The number of seedlings planted, and the comparison between the area planted and the area seeded per year from 2012 to 2022.
Graph data
| Year | Area artificially regenerated (hectares) | Number of seedlings planted (millions) | |
|---|---|---|---|
| Area planted | Area seeded | ||
| 2012 | 348,973 | 10,541 | 487 |
| 2013 | 420,167 | 11,638 | 554 |
| 2014 | 412,939 | 17,268 | 550 |
| 2015 | 401,178 | 19,764 | 576 |
| 2016 | 401,895 | 28,889 | 608 |
| 2017 | 432,028 | 17,909 | 616 |
| 2018 | 428,091 | 6,858 | 611 |
| 2019 | 441,097 | 8,802 | 617 |
| 2020 | 463,303 | 13,592 | 660 |
| 2021 | 486,671 | 8,743 | 682 |
| 2022 | 413,083 | 9,766 | 584 |
Indicator: Volume harvested relative to the sustainable wood supplyFootnote 4
Information on the annual harvest compared to the supply that is deemed sustainable for harvest. This indicator is important to ensure the volume of industrial roundwood harvested each year falls within sustainable levels.
Indicator details
In 2022, Canada harvested 129.5 million cubic metres (m3) of industrial roundwood (tree felled and debranched), which is well below the estimated sustainable wood supply level of 213.6 million m3.
- The harvested industrial roundwood volume decreased by 7.6 million m3 from 2021 levels. At the same time, the estimated wood supply deemed to be sustainable declined by 1.5 million m3.
- The gap between the volume of industrial roundwood harvested and the sustainable wood supply is widening. The harvested proportion of wood supply in 2022 is 6.4% lower than the average over the last decade (2012–2021).
- Canada continues to harvest at levels that are below the level deemed to be sustainable for long--term wood supply.
- The decrease in harvest is mostly attributable to the net decrease in timber volumes harvested in British Columbia, Québec and Alberta.
- As part of the path to Indigenous reconciliation, and in recognition of the inherent rights of Indigenous Peoples, Canada has been in the process of redistributing timber harvesting rights. Between 2003 and 2020, the allowable annual cut (AAC) for Indigenous Peoples increased from 4.5% to 9.9%.
Sustainable wood supply refers to the volume of timber that can be harvested annually from federal, provincial, territorial and private lands, while meeting long-term environmental, economic and social objectives as set out in legislations that regulate timber harvesting. Wood supply refers to industrial roundwood supplies only.
Why is this indicator important?
- Forest managers and jurisdictions track the volume of industrial roundwood harvested each year to ensure it falls within long-term sustainable levels, as set out in provincial legislation and policies that regulate harvesting on provincial lands.
- Harvests from provincial Crown lands are regulated by the AAC that each province sets. Although there is no AAC calculation for Canada as a whole, it is possible to compare the combined provincial AACs with the combined harvest totals from the same provincial Crown land base.
What is the outlook?
- Demand for Canadian wood products will remain strong, driven by the demand for new housing, the high quality of Canadian pulp and the increased use of wood fibre in new bioproducts.
- Harvest levels are expected to remain below the sustainable wood supply.
- The sustainable wood supply will continue to decline over the next several years, since AACs in many jurisdictions are reduced in response to the impact of insect outbreaks (e.g., mountain pine beetle, spruce budworm), hurricanes, severe wildland fires, and the measures protecting woodland caribou habitat and old-growth forests.
How government initiatives support sustainable forest management
- The Canadian Forest Service develops knowledge, tools and approaches aimed at increasing forest resiliency, thereby reducing the risks to the forest fibre supply of Canada.
- The National Forest Inventory, and the National Forestry Database, which are collaborative efforts involving federal, provincial and territorial government agencies, help assess Canada’s forests health and sustainable forest management. They provide reliable sources of national information on the extent, composition and characteristics of forests, and monitor changes to forest ecosystems over time through data on forest wildland fires, insect outbreaks and forest harvesting.
Annual harvest versus supply deemed sustainable for harvest, 1990-2022
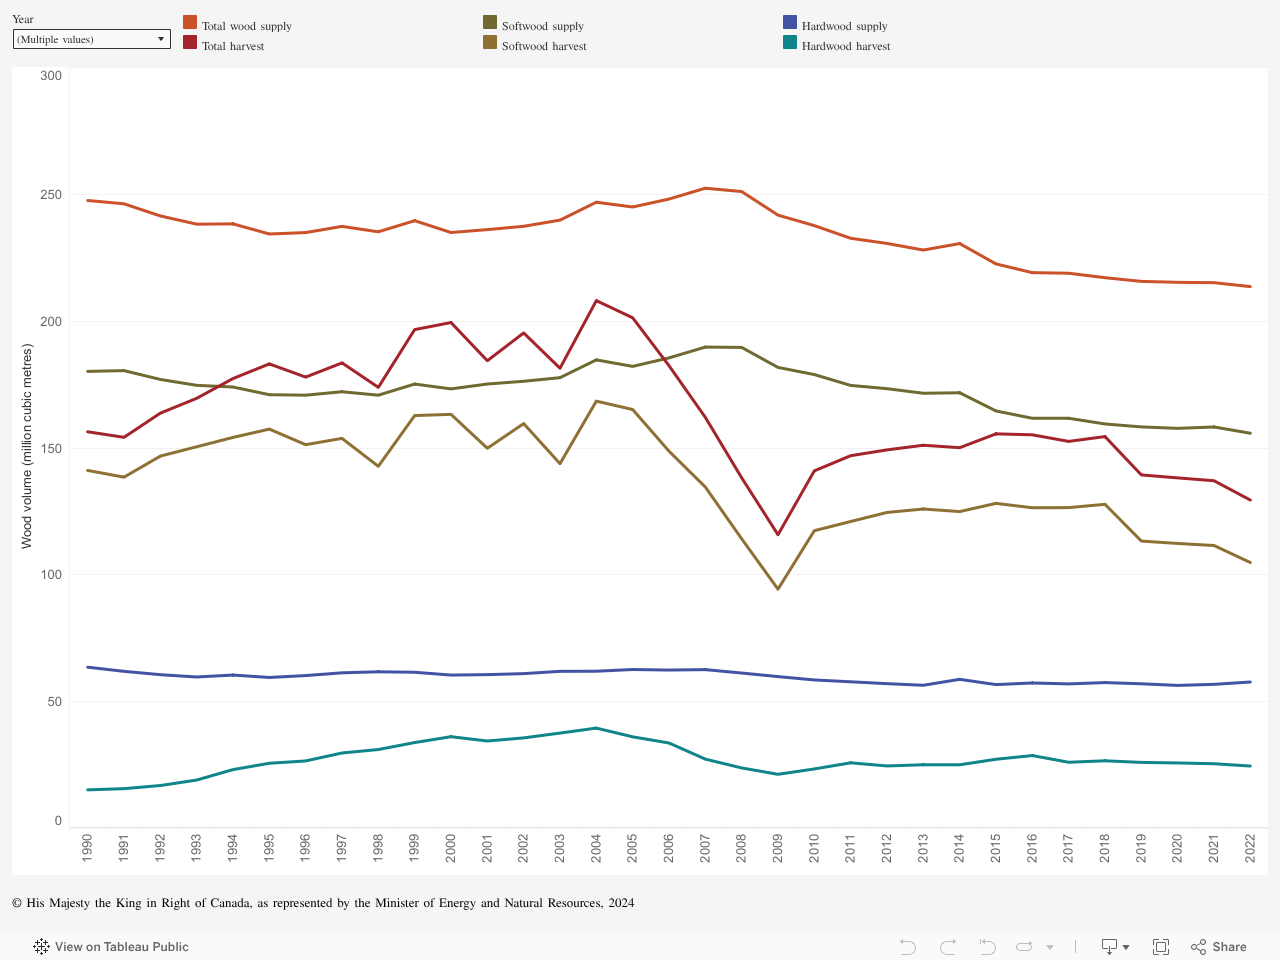
Graph summary
Comparison between the volumes of annual harvest and supply per year for hardwood, softwood, and total between 1990 and 2022.
Graph data
| Year | Wood volume (million cubic metres) | |||||
|---|---|---|---|---|---|---|
| Total wood supply | Total harvest | Softwood supply | Softwood harvest | Hardwood supply | Hardwood harvest | |
| 1990 | 247.6 | 156.4 | 180.2 | 141.2 | 63.6 | 15.2 |
| 1991 | 246.3 | 154.2 | 180.5 | 138.5 | 62.0 | 15.7 |
| 1992 | 241.5 | 163.7 | 177.0 | 146.8 | 60.6 | 16.9 |
| 1993 | 238.2 | 169.6 | 174.7 | 150.5 | 59.7 | 19.1 |
| 1994 | 238.4 | 177.4 | 174.0 | 154.2 | 60.5 | 23.2 |
| 1995 | 234.4 | 183.2 | 171.0 | 157.4 | 59.5 | 25.7 |
| 1996 | 234.9 | 177.9 | 170.8 | 151.3 | 60.3 | 26.6 |
| 1997 | 237.4 | 183.6 | 172.2 | 153.8 | 61.4 | 29.8 |
| 1998 | 235.2 | 173.9 | 170.8 | 142.8 | 61.8 | 31.1 |
| 1999 | 239.6 | 196.7 | 175.2 | 162.8 | 61.6 | 33.9 |
| 2000 | 234.9 | 199.5 | 173.3 | 163.3 | 60.5 | 36.2 |
| 2001 | 236.1 | 184.4 | 175.2 | 149.9 | 60.7 | 34.5 |
| 2002 | 237.4 | 195.4 | 176.3 | 159.6 | 61.1 | 35.7 |
| 2003 | 239.8 | 181.4 | 177.7 | 143.8 | 62.0 | 37.6 |
| 2004 | 246.9 | 208.1 | 184.7 | 168.5 | 62.0 | 39.6 |
| 2005 | 245.0 | 201.3 | 182.2 | 165.2 | 62.7 | 36.1 |
| 2006 | 248.1 | 182.5 | 185.5 | 148.7 | 62.5 | 33.7 |
| 2007 | 252.4 | 162.1 | 189.8 | 134.6 | 62.6 | 27.3 |
| 2008 | 251.1 | 138.3 | 189.7 | 114.2 | 61.3 | 23.9 |
| 2009 | 241.8 | 115.8 | 181.8 | 94.3 | 59.9 | 21.4 |
| 2010 | 237.7 | 141.0 | 179.0 | 117.4 | 58.6 | 23.5 |
| 2011 | 232.7 | 147.0 | 174.7 | 121.0 | 57.8 | 25.9 |
| 2012 | 230.6 | 149.3 | 173.4 | 124.6 | 57.1 | 24.7 |
| 2013 | 228.0 | 151.1 | 171.6 | 126.0 | 56.5 | 25.1 |
| 2014 | 230.6 | 150.1 | 171.8 | 124.9 | 58.8 | 25.1 |
| 2015 | 222.6 | 155.6 | 164.6 | 128.2 | 56.7 | 27.3 |
| 2016 | 219.1 | 155.2 | 161.7 | 126.4 | 57.4 | 28.8 |
| 2017 | 218.9 | 152.6 | 161.7 | 126.5 | 57.0 | 26.1 |
| 2018 | 217.1 | 154.5 | 159.5 | 127.8 | 57.5 | 26.7 |
| 2019 | 215.7 | 139.4 | 158.3 | 113.3 | 57.1 | 26.1 |
| 2020 | 215.3 | 138.2 | 157.7 | 112.4 | 56.4 | 25.8 |
| 2021 | 215.2 | 137.1 | 158.3 | 111.6 | 56.8 | 25.5 |
| 2022 | 213.6 | 129.5 | 155.8 | 104.9 | 57.8 | 24.6 |