
On this page
- Theme introduction
- Indicator: Forest sector financial performance
- Indicator: Forest sector secondary manufacturing
- Indicator: Forest sector carbon emissions
- Sources and information
Theme introductionFootnote 1
Canada’s forest sector is experiencing changing market conditions as the preferences of consumers and businesses evolve. For example:
- Demand for sustainable construction materials and methods, in addition to more sophisticated design and production systems, is stimulating the construction market in Canada. Forty-nine mass timber projects began between 2007 and 2009, whereas 170 mass timber projects began between 2019 and 2021.
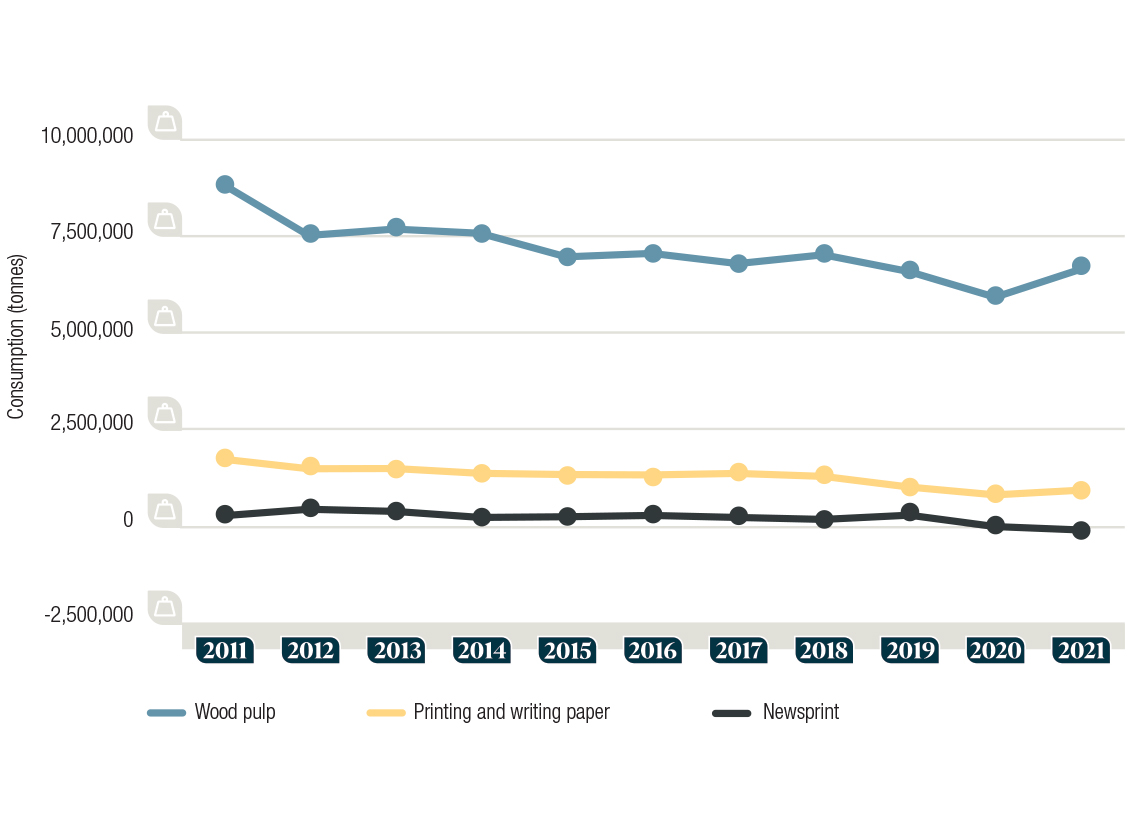
- Domestic consumption of newsprint, printing and writing paper as well as wood pulp has been decreasing, with the most drastic decline for wood pulp (2011—2021).
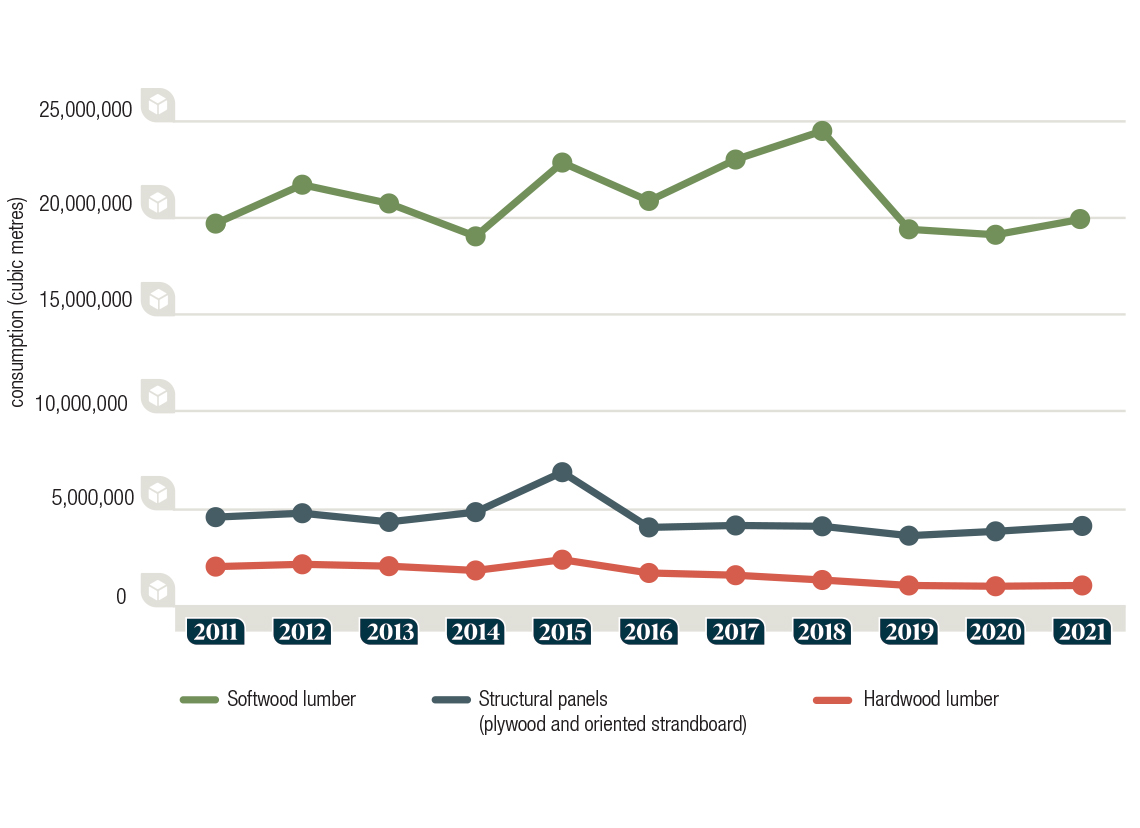
- Domestic consumption of softwood lumber has had the highest and most fluctuating domestic consumption compared to hardwood lumber and structural panels. Trendlines for domestic consumption of structural panels and hardwood lumber have been decreasing slightly (2011—2021).
Consumption of forest products, cubic metres 2011-2021
Graph summary
Line graph showing the consumption of hardwood lumber, structural panels and softwood lumber, in cubic metres, between 2011 and 2021.
Graph data
| Year | Hardwood lumber (cubic metres) | Softwood lumber (cubic metres) | Structural panels (plywood and oriented strandboard) (cubic metres) |
|---|---|---|---|
| 2011 | 2,011,518 | 19,728,538 | 4,566,770 |
| 2012 | 2,131,137 | 21,736,796 | 4,768,771 |
| 2013 | 2,034,605 | 20,769,674 | 4,320,669 |
| 2014 | 1,812,295 | 19,068,561 | 4,825,666 |
| 2015 | 2,368,663 | 22,880,901 | 6,887,924 |
| 2016 | 1,683,436 | 20,899,547 | 4,036,831 |
| 2017 | 1,567,662 | 23,036,173 | 4,136,944 |
| 2018 | 1,319,708 | 24,512,074 | 4,094,247 |
| 2019 | 1,038,214 | 19,433,524 | 3,609,425 |
| 2020 | 997,116 | 19,151,057 | 3,832,670 |
| 2021 | 1,038,494 | 19,963,049 | 4,111,910 |
Consumption of forest products, tonnes 2011-2021
Graph summary
Line graph showing the consumption of newsprint, printing and writing paper, and wood pulp, in tonnes, between 2011 and 2021.
Graph data
| Year | Newsprint (tonnes) | Printing and writing paper (tonnes) | Wood pulp (tonnes) |
|---|---|---|---|
| 2011 | 276,260 | 1,738,393 | 8,833,399 |
| 2012 | 444,321 | 1,490,215 | 7,513,735 |
| 2013 | 389,986 | 1,496,071 | 7,677,944 |
| 2014 | 233,453 | 1,372,133 | 7,570,014 |
| 2015 | 250,812 | 1,341,152 | 6,961,600 |
| 2016 | 284,713 | 1,331,133 | 7,050,006 |
| 2017 | 232,758 | 1,369,743 | 6,786,756 |
| 2018 | 182,595 | 1,293,082 | 7,014,631 |
| 2019 | 291,366 | 1,017,531 | 6,579,011 |
| 2020 | -2,722 | 815,903 | 5,919,175 |
| 2021 | -90,833 | 937,245 | 6,643,821 |
The bioeconomy in other countries
Countries have responded to shifting markets by developing bioeconomy opportunities. The bioeconomy seeks sustainably sourced biomass for bioproducts. Achieving the bioeconomy’s environmental, economic and social benefits requires strategies or other policies to set a vision for a sustainable economy over the long term. Sustainable bioeconomy policies need to support goals, such as conservation, climate change mitigation and an inclusive economy.
For example, Finland’s bioeconomy strategy highlights the added value of new bio-based products in several industries, such as pharmaceuticals and fashion, which are based on renewable materials produced sustainably. Finland aims to be climate neutral by 2035.
The United States federal government announced key steps in advancing biotechnology and biomanufacturing. In response, several federal departments are collaborating to support the resilience of the United States biomass supply while also advancing food security, environmental sustainability and an inclusive economy. Work is ongoing and moving rapidly.
The global bioeconomy
There are also international developments seeking to guide a sustainable bioeconomy. For example, Brazil’s G20 Presidency has led the development of High-Level Principles for the Bioeconomy.
As well, the United Nations Food and Agriculture Organization has recognized the multiple benefits of bioeconomy. It issued a paper entitled Aspirational principles and criteria for a sustainable bioeconomy, an overview of the role that social, economic, environmental and governance dimensions play when considered together for the benefit of communities and the global environment.
Working toward a Canadian forest bioeconomy
Canada’s forest sector has a key role to play too. Canada’s forest sector is responding to market conditions and global environmental commitments by transitioning to a circular bioeconomy that supports environmental conservation and a sustainable economy. The circular bioeconomy is also a large contributor to the environmental and clean technology products sector.
The Canadian Council of Forest Ministers is working to implement the Renewed Forest Bioeconomy Framework to accelerate the growth of the bioeconomy. In addition, biomass industries in Canada came together to form Bioindustrial Innovation Canada, a partnership that produced Canada’s Bioeconomy Strategy. This strategy puts forth recommendations to support a clean economy.
Indicator: Forest sector financial performanceFootnote 2
Annual financial performance of Canada’s forest sector. Monitoring the financial performance of the forest sector indicates whether Canada’s forest sector can attract investment and continue generating economic benefits for Canadians.
Indicator details
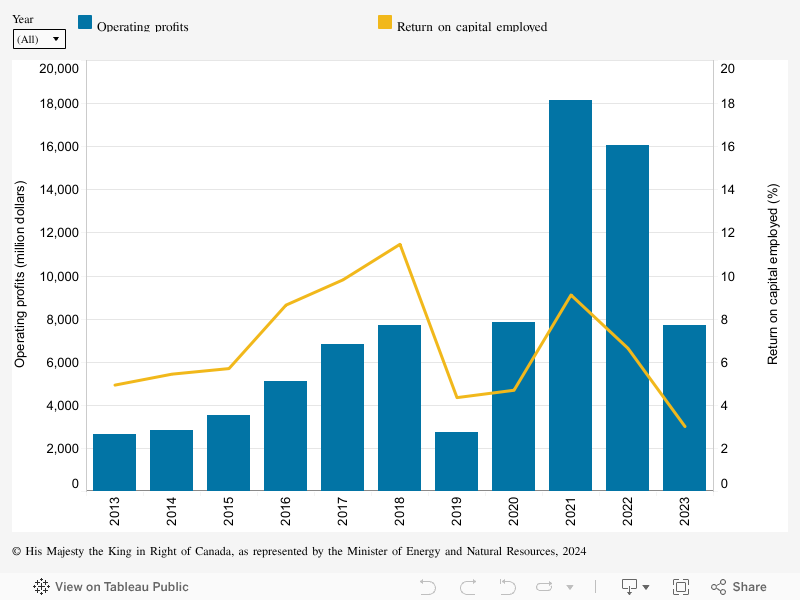
Both operating profits and the return on capital employed indicate the economic competitiveness of the forest sector. The operating profit measures the difference between operating revenues and operating expenses. The return on capital employed measures the efficiency of capital in the sector.
In 2023, the financial performance in the forest sector was weaker than the pandemic-related surges seen in 2021–2022 when product prices were favourable. Operating profits dropped more than 50% from 2022 to 2023 but were comparable to 2018 levels (the pre-pandemic record high), and 180% higher than in 2019. The forest sector is a capital-intensive industry and generated a return on capital employed of 3.0% in 2023, less than half the return in 2022 (6.6%), and nearly four times less than in 2018.
- While commodity pulp prices bounced back at the end of 2023, panel and lumber prices dropped from record highs in 2021 and 2022 to prices below pre-pandemic levels.
- Overall, 2023 price levels were insufficient to offset the rising operating and investment costs resulting from inflation and relatively higher interest rates, as well as labour and high fibre costs—resulting in a drop in the returns on investments.
- Weaker financial performance across the sector has led to a decline in available financial liquidity, forcing many companies to implement cost-cutting measures and to reduce their level of investment.
Why is this indicator important?
- Strong financial performance is essential for the continued economic competitiveness of Canada’s forest sector.
- Both operating profits and return on capital employed are indicative of the ability of the forest sector to attract investment and generate economic benefits for Canadians.
What is the outlook?
- In the short term, the financial performance of the sector will continue to be impacted by high interest rates, which have reduced housing construction activity and, therefore, the demand for lumber and solid wood products.
- The housing sector, through residential improvements or new constructions, is a key consumer of forest products (e.g., lumber and solid wood products). This explains the strong link between housing and forest sectors.
- Over the medium term, both Canada and the United States aim to address the housing affordability by increasing wood supply. An increase in housing starts is expected to improve the financial performance and return on investment in this sector.
- Financial results in the pulp and paper sector will continue to be negatively impacted by declining sales of traditional paper products but partially mitigated by increasing revenues in packaging products.
- The focus on innovation and on value-added forest products should support the financial outlook of the whole forest sector.
How government initiatives support sustainable forest management
- The federal Investments in Forest Industry Transformation program is one example of how the GOC facilitates the adoption of transformative and innovative technologies and products to support new or diversified revenue streams, such as next generation building products, advanced biomaterials, biochemicals, and biofuels.
Financial performance by Canada’s forest sector, 2013–2023
Graph summary
The operating profits and return on capital employed in the forest sector for each year between 2013 and 2023.
Graph data
| Year | Operating profits (million dollars) | Return on capital employed (%) |
|---|---|---|
| 2013 | 2,633 | 4.9 |
| 2014 | 2,811 | 5.4 |
| 2015 | 3,508 | 5.7 |
| 2016 | 5,121 | 8.6 |
| 2017 | 6,816 | 9.8 |
| 2018 | 7,698 | 11.5 |
| 2019 | 2,743 | 4.4 |
| 2020 | 7,834 | 4.7 |
| 2021 | 18,129 | 9.1 |
| 2022 | 16,070 | 6.6 |
| 2023 | 7,688 | 3.0 |
Indicator: Forest sector secondary manufacturingFootnote 3
Annual gross domestic product (GDP) for primary and secondary wood and paper product subsectors. This indicator provides information on additional employment and revenue for the forest sector, providing a better idea of the forest sector’s overall contribution to the Canadian economy.
Indicator details
The secondary wood and paper product manufacturing industries in Canada generated $6.67 billion in real gross domestic product (GDP) in 2023, a decrease of 2.1% from the 2022 level.
- Secondary wood manufacturing real GDP increased 1.9% over 2022 levels, with weak domestic sales offset by stronger net export sales.
- Secondary paper manufacturing real GDP decreased 7.5% below 2022 levels despite a 10% increase in net exports and no significant change in domestic sales, which could be explained via a rise in production costs.
Secondary wood and paper product manufacturing is the further processing of lumber and raw paper material into more finished products such as cabinets, wood pellets, stationery products and tissue paper.
The industry GDP shows its contribution to the economy. It is the value added by calculating difference between the value of the industry’s output and the value of the intermediate goods and services it purchases from other industries.
Why is this indicator important?
- The secondary forest product manufacturing sector diversifies economic activities beyond the primary sector. It generates additional employment and revenue while mitigating risks from timber supply decreases to the overall economy and forest-dependent communities.
- Secondary forest product manufacturing is domestic market-focused, which is more stable than the international market where the primary forest products are oriented. This difference mitigates the impacts of price fluctuations of the primary forest products in global markets on the general economy.
What is the outlook?
- The current trend is expected to continue, with the secondary wood manufacturing sector expanding at a modest growth rate. The outlook will be influenced by downward trends in housing construction due to higher interest rates in recent years.
- The secondary paper product sector could continue to face challenges, despite the positive trend in online shopping and health and sanitation, to which it is closely linked. Ongoing external competition poses another key risk factor for this sector in addition to the possible increase in production costs.
How government initiatives support sustainable forest management
- The federal Forest Innovation Program provides funding for research and development to improve innovation and productivity in the sector.
Gross domestic product from primary and secondary wood and paper product subsectors, 2013–2023
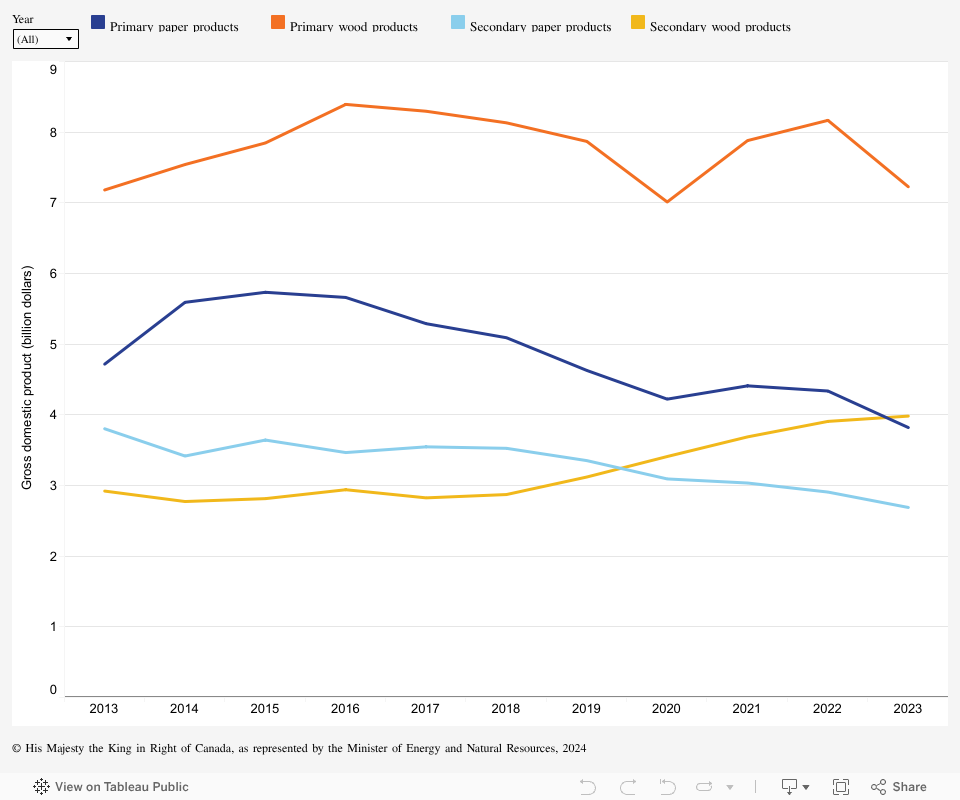
Graph summary
Comparison of the gross domestic product from primary and secondary wood and paper products in Canada for each year between 2013 and 2023.
Graph data
| Year | Gross domestic product (billion dollars) | |||
|---|---|---|---|---|
| Primary paper products | Primary wood products | Secondary paper products | Secondary wood products | |
| 2013 | 4.7 | 7.2 | 3.8 | 2.9 |
| 2014 | 5.6 | 7.5 | 3.4 | 2.8 |
| 2015 | 5.7 | 7.8 | 3.6 | 2.8 |
| 2016 | 5.7 | 8.4 | 3.5 | 2.9 |
| 2017 | 5.3 | 8.3 | 3.5 | 2.8 |
| 2018 | 5.1 | 8.1 | 3.5 | 2.9 |
| 2019 | 4.6 | 7.9 | 3.4 | 3.1 |
| 2020 | 4.2 | 7.0 | 3.1 | 3.4 |
| 2021 | 4.4 | 7.9 | 3.0 | 3.7 |
| 2022 | 4.3 | 8.2 | 2.9 | 3.9 |
| 2023 | 3.8 | 7.2 | 2.7 | 4.0 |
Indicator: Forest sector carbon emissionsFootnote 4
Annual trends in fossil fuel greenhouse gas (GHG) emissions and total energy use. Monitoring emissions and energy use provides data on how the forest sector can become more sustainable and provide climate solutions.
Indicator details
Following a pronounced reduction between 2005 and 2011, greenhouse gas (GHG) emissions from the use of fossil fuels at forest sector facilities have declined more slowly since 2011. Reductions in GHG emissions followed improvements in energy efficiency, increased use of forest biomass for heat and power generation, and reduced production capacity for certain types of forest products.
- Bioenergy meets 55% of the total annual energy demand of the forest sector and has reduced GHG emissions from fossil fuels (direct and indirect emissions) at forest product facilities by 51% between 2005 and 2021.
- Energy efficiency improvements have helped reduce the total energy demand for the sector by 23% between 2005 and 2021.
- GHG emissions were at an all-time low in 2020, during the peak of the COVID-19 pandemic, but increased slightly in 2021. This rise is due, in part, to the increase in production of construction materials such as oriented strand board (OSB) panels and lumber.
Canada’s forest sector reduces emissions in other sectors, by utilizing residual forest biomass to produce bioenergy and biomaterials. Biomass is mainly a byproduct of forest product manufacturing (i.e., lumber, pulp and paper, etc.), and increasingly post consumer and demolition waste. In the future, activities such as forest thinning and fire-smarting could become sources of biomass.
Canada continues to address gaps in the estimation of forest biomass availability to improve its effectiveness as a feedstock for several bioproducts, including biofuels.
Why is this indicator important?
- Tracking annual emissions from fossil fuels is important for ensuring the forest sector continues to transition to net zero while providing low-carbon forest products to Canada and the world.
- Reliable and accurate data on GHG emissions associated with forest sector facilities and harvesting operations are critical to the evaluation of embodied carbon, such as life cycle GHG emissions of forest products. GHG emissions reported in this report relate to harvest operations and forest product manufacturing. When combined with emissions data from other life cycle stages such as transportation, use and end-of-life, a comprehensive assessment of the overall carbon footprint of forest products is provided and a more accurate comparison with other materials is possible.
What is the outlook?
- Canada is committed to reducing the embodied carbon of buildings, for example, using mass timber in replacement of more carbon-intensive materials.
- Bioenergy with carbon capture and sequestration technology can support Canada’s decarbonization goals and result in net negative emissions energy production. Carbon emission management opportunities also exist for biomass carbon removal and storage. These opportunities cover all technologies and practices that facilitate the removal and storage of biomass CO2 from the atmosphere, such as applying biochar, a stable form of carbonized biomass, to agricultural land as a soil amendment.
How government initiatives support sustainable forest management
- The development of requirements related to embodied GHG emissions for inclusion in the 2030 National Model Codes and Canada’s Buy Clean Strategy, which emphasizes public procurement of low carbon materials, will help reduce embodied carbon of buildings.
Fossil fuel greenhouse gas emissions and total energy use in Canada’s forest sector, 2005–2021
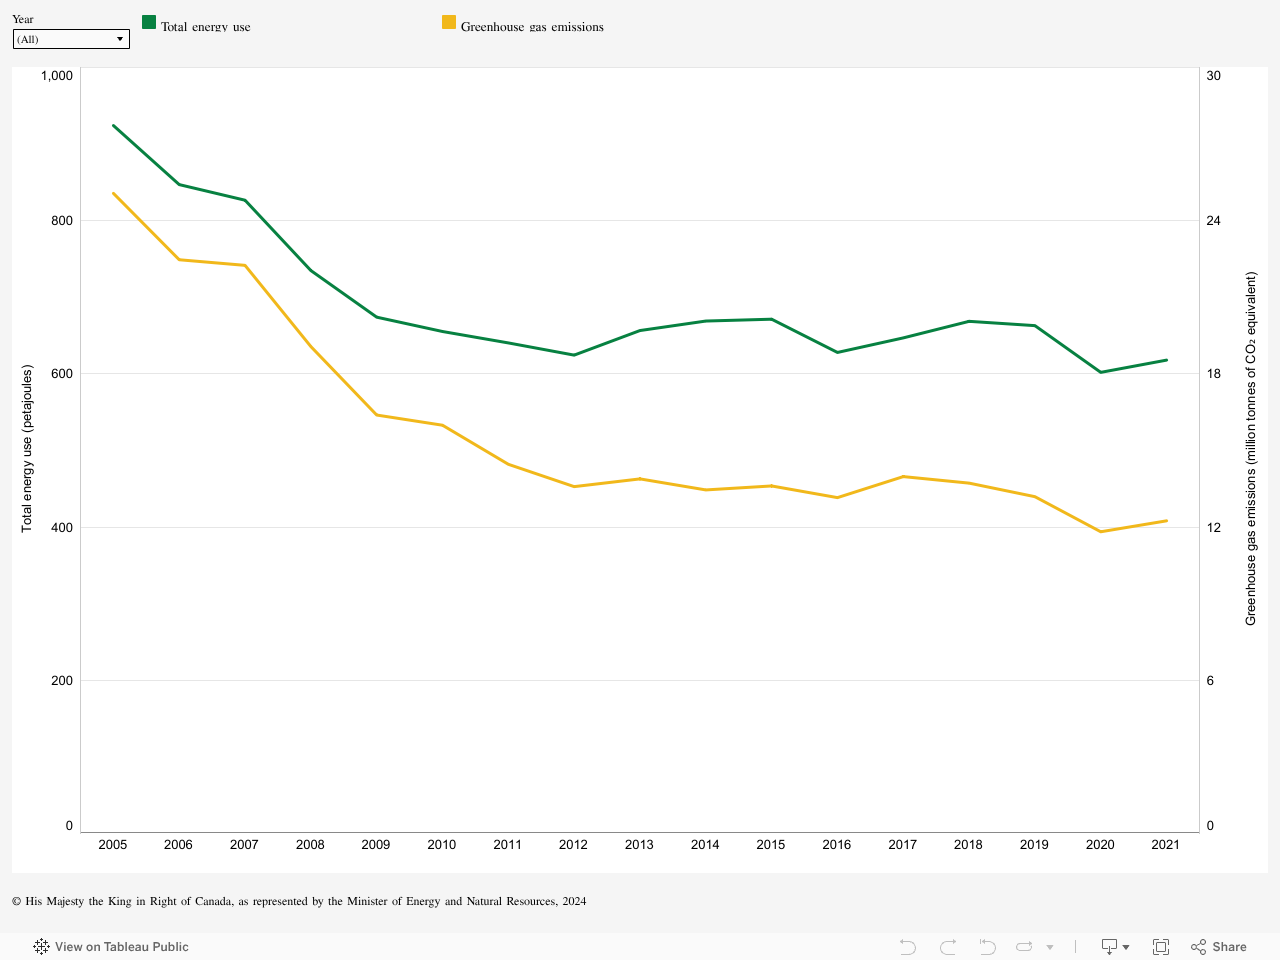
Graph summary
The total energy use and the greenhouse gas emissions from Canada’s forest sector for each year between 2005 and 2021.
Graph data
| Year | Total energy use (petajoules) | Greenhouse gas emissions (million tonnes of CO₂ equivalent) |
|---|---|---|
| 2005 | 924 | 25.1 |
| 2006 | 847 | 22.5 |
| 2007 | 827 | 22.3 |
| 2008 | 735 | 19.1 |
| 2009 | 674 | 16.4 |
| 2010 | 655 | 16.0 |
| 2011 | 640 | 14.5 |
| 2012 | 625 | 13.6 |
| 2013 | 657 | 13.9 |
| 2014 | 669 | 13.5 |
| 2015 | 671 | 13.6 |
| 2016 | 628 | 13.2 |
| 2017 | 647 | 14.0 |
| 2018 | 669 | 13.7 |
| 2019 | 663 | 13.2 |
| 2020 | 602 | 11.8 |
| 2021 | 618 | 12.2 |