
On this page
- Theme introduction
- Changes in forest area
- Indicator: Forest area
- Indicator: Deforestation and afforestation
- Indicator: Wood volume
- Sources and information
Theme introductionFootnote 1
Canada is home to 369 million hectares (ha) of forest, or 3.69 million km2, which is close to 9% of the world’s total forest. To get a sense of the area of Canada’s forests, the land area of India is about 297 million ha. Canadians depend on and value these forests for many different uses including recreation, conservation, traditional Indigenous practices and sustainable timber harvest. Strict rules require harvest areas to be regenerated either through planting or natural regrowth. Canada’s National Deforestation Monitoring System reports that over the last 34 years, less than half of 1% of Canada’s forest has been deforested.
What is a forest?
Canada’s National Forest Inventory (NFI) uses the United Nations Food and Agriculture Organization definition of forest area:
- land not predominantly under agricultural or urban land use
- spanning an area greater than 0.5 ha
- with trees taller than 5 m and tree canopy cover of more than 10%
OR
- land that has the capability to support trees taller than 5 m with more than 10% canopy cover
Forest area is still considered to be forest after a temporary loss of tree cover, such as after wildfire or clearcut harvesting. Changes in forest area result from:
- Afforestation—the deliberate establishment of forests on lands previously not forested
- Deforestation—the permanent clearing of forests to make way for new, non-forest land uses, such as agriculture or urban expansion
- Natural forest expansion or dieback
How do we monitor the change in our forests?
The Canadian Forest Service (CFS) works with provincial and territorial partners to maintain Canada’s national forest monitoring and reporting capabilities via the NFI, the National Forest Information System, the National Forestry Database and the National Forest Carbon Monitoring Accounting and Reporting System. Remote sensing also plays a crucial role enabling increasingly more detailed forest monitoring over large areas.
The technology and programs that Canada uses to monitor forests and how they change have evolved since the creation of the CFS 125 years ago. While each province and territory have long-standing programs to monitor forests in their jurisdictions, the NFI is only 24 years old. In comparison, Sweden, the United Kingdom (UK), and several other countries have decades of data collected through their NFIs. Canada’s relatively young NFI was created to ensure our forest monitoring uses a statistically robust sampling approach by using a national plot network with consistent methodology. The NFI replaced older monitoring methods such as the Canadian Forest Inventory (CanFI), which relied on data submissions from various sources and did not include large areas of northern forests.
Select National Forest Inventories around the world
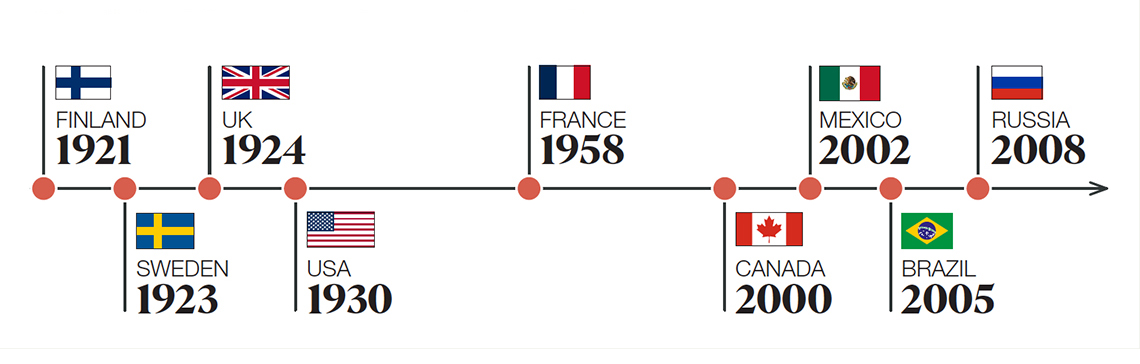
Image summary
Flags representing each country and the year their NFIs were established.
Select National Forest Inventories around the world
- Finland (1921)
- UK (1924)
- France (1958)
- Mexico (2002)
- Russia (2008)
- Sweden (1923)
- USA (1930)
- Canada (2000)
- Brazil (2005)
Canada’s NFI was created to provide recurrent estimates and show changes over time for many forest attributes across the country. Forest change is determined by comparing the values between two points in time, which helps us understand trends. Shortly after Canada’s NFI was created, the CFS could publish point estimates of many forest attributes. However, only recently has enough data been collected to publish information on forest change. This is a major milestone for our NFI! Using data collected between 2000 and 2017, we can estimate changes in Canadian forests over that period. This is the time between the “establishment” and “first remeasurement” periods as seen below.
Canada’s National Forest Inventory measurement periods
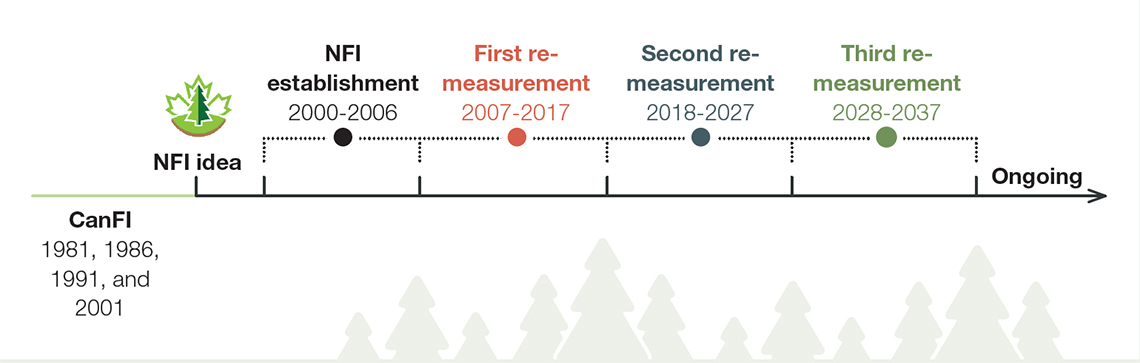
Image summary
Canada’s National Forest Inventory measurement periods
- CanFI (1981, 1986, 1991 and 2001)
- NFI idea
- NFI establishment (2000-2006)
- First re-measurement (2007-2017)
- Second re-measurement (2018-2027)
- Third re-measurement (2028-2037)
- Ongoing
As the NFI continues to collect new monitoring data through the second remeasurement period and beyond, previously published values will be revised as older data and methods are replaced. For more information on how the NFI estimates change in forest attributes, see the Sources and information section.
Changes in forest area
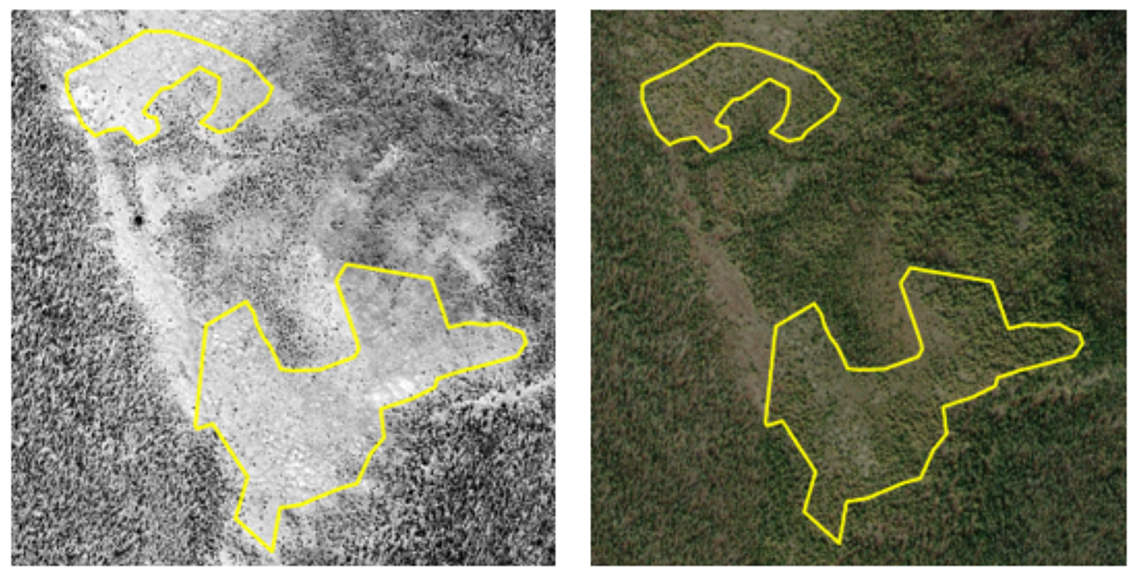
Forest area in Canada changes over time. Forest monitoring over the last 2 decades shows a very small forest area increase at the national level, with increases in some regions mostly balanced by decreases in others. Using the NFI’s very high spatial resolution remote sensing data, we can identify that some of these changes are ecological changes and others are administrative changes. Ecological changes include natural forest expansion (see figure) and deliberate forest expansion through afforestation, i.e., planting trees in areas that were previously non-forested. Administrative changes increase forest area where land use designation shifts from agriculture to forestry. Technological enhancements that enable more accurate measurements of land and water attributes can also cause our numbers to change relative to older numbers generated using less precise data. Detailed investigation reveals the extent to which overall changes are driven by these different factors while ongoing, consistent monitoring across all of Canada’s forests will enable further identification of forest area trends and drivers.
Figure: An example of natural forest expansion in the Taiga Plains ecozone. Yellow polygons outline the change from non-treed land areas in 2005 (left) to treed areas in 2021 (right).
Indicator: Forest areaFootnote 2
Long-term trends in forest area across Canada. A relatively stable forest area is an important indication that forests are being managed sustainably and are, therefore, a stable provider of resources, biodiversity and diverse environmental services.
Indicator details
Canada has 369 million ha of forest area with many unique forest types. Over the 125 years that the Canadian Forest Service (CFS) has existed, some of this forest has undergone noticeable change and some of it appears relatively unchanged. Forests in areas prone to natural disturbance may have burned and naturally regenerated two or three times in the past 125 years, while forests in other locations may be more than five times older than the CFS!
- Compared with total forest area, both afforestation and deforestation in Canada are small. Canada’s forests have seen less than half of 1% deforestation since 1990.
- The deforestation that occurs is due to agriculture, mining, oil and gas, forest roads and landings, urban development, and hydroelectric development. There is less recorded afforestation than deforestation in Canada.
- Canada uses the internationally agreed to definition of forest area, established by the United Nations Food and Agricultural Organization, to ensure consistency across countries when reporting this important forest attribute.
- While forest area in Canada is relatively stable, the tree cover within is more dynamic due to wildland fires, insect infestations, harvest activities and forest cover re-growth.
You are probably aware of recent wildland fires, forest pest outbreaks and discussions around harvest levels. Have you wondered how they affect forest area? While these examples may have an impact on tree cover and other forest conditions, they only affect forest area when the forest cover losses are not followed by natural regeneration or reforestation. Forest area loss occurs due to permanent events like deforestation or natural forest regeneration failure.
Improved data reveal positive trend in forest area
Continued investments and enhancement of the National Forest Inventory (NFI) positions Canada to report, for the first time, forest area trends based on statistically robust repeat pan-Canadian forest measurements.
In previous State of Canada’s Forests reports, Canada used the best available data on forest area at a single point in time, from the NFI, together with the best available data on deforestation and afforestation, from deforestation monitoring and available afforestation records, to report on forest area changes between 1990 and present.
As a result of the addition of new data, the NFI now reveals that previously unreported increases in forest area are occurring in Canada’s forests. The trend is very small relative to the overall size of Canada’s forest. The probable causes for the observed modest increase in forest area include a combination of: natural infilling of former gaps in the forest, natural expansion at forest margins, the establishment of trees in areas that previously could not support them, the reclassification of areas recovering slowly from previous fires or disturbances which were mistakenly identified as non-forested, afforestation efforts, and land use designation changes where treed agricultural land has been designated as forest.
Consistent with the NFI data, recent research studies based on satellite measurements only have observed small increases in forest cover, that is, natural forest infilling and expansion as an important driver of increases. For the scientific community, trends in forest area (and forest cover) will continue to be an area of active investigation.
Percentage of forest land by age in Canada
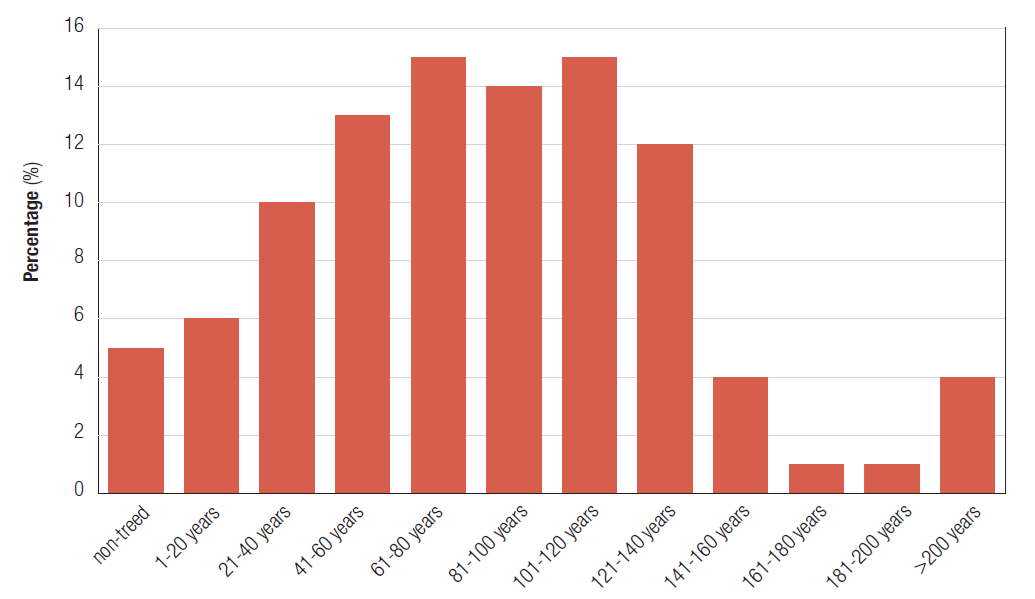
Graph summary
Percentage of forest land by age class in Canada
Graph data
| Percentage (%) | |
|---|---|
| Non-treed | 5 |
| 1-20 years | 6 |
| 21-40 years | 10 |
| 41-60 years | 13 |
| 61-80 years | 15 |
| 81-100 years | 14 |
| 101-120 years | 15 |
| 121-140 years | 12 |
| 141-160 years | 4 |
| 161-180 years | 1 |
| 181-200 years | 1 |
| >200 years | 4 |
Forests are dynamic ecosystems and continuously undergo cycles of growth, disturbance and regrowth. Where natural disturbances occur frequently, such as in fire-prone landscapes, these cycles repeat more frequently and there are fewer old stands, even in the absence of human disturbance. In areas less exposed to large forest disturbances like on islands and along lakeshores, where water acts as a fuel break, forests can remain undisturbed for centuries and older stands can develop. In the absence of major disturbances (e.g., wildfire or clear-cutting), old-growth forests continue to evolve through small-scale disturbances such as the death of individual trees.
Why is this indicator important?
- Understanding changes in total forest area in Canada is an important part of monitoring sustainable forest management. Healthy and functioning forest area provides habitats for biodiversity and many important ecosystem goods and services.
- The international community continues to put great emphasis on understanding global forest area changes. Although Canada’s forest area has been relatively stable in recent history, it remains important to monitor the effects of human activities and climate change.
What is the outlook?
- Natural increases and decreases in forest area tend to occur gradually where and when growing conditions or disturbance patterns allow. National forest monitoring, through the NFI, enables us for the first time to report these changes at the national scale. Changes to natural ecosystem processes induced by climate change may accelerate this historically slow process.
- Forest area is expected to remain generally stable. Rates of human-induced change are likely to remain low (See the indicator Deforestation and afforestation for more information).
How government initiatives support sustainable forest management
- The federal government’s Forest Systems Information and Technology Enhancement (ForSITE) program will enhance the forest information available to support forest management decisions for sustainable and resilient forests and to publicly report on forest inventory and management practices.
Canada’s estimated forest area, 1990-2023

Graph summary
Canada’s estimated forest area trends between 1990 and 2023.
Graph data
| Year |
Forest area (million hectares) |
|---|---|
| 1990 | 360,777 |
| 1991 | 360,723 |
| 1992 | 360,668 |
| 1993 | 360,618 |
| 1994 | 360,541 |
| 1995 | 360,501 |
| 1996 | 360,466 |
| 1997 | 360,430 |
| 1998 | 360,392 |
| 1999 | 360,351 |
| 2000 | 360,305 |
| 2001 | 360,818 |
| 2002 | 361,330 |
| 2003 | 361,843 |
| 2004 | 362,355 |
| 2005 | 362,868 |
| 2006 | 363,381 |
| 2007 | 363,893 |
| 2008 | 364,406 |
| 2009 | 364,918 |
| 2010 | 365,431 |
| 2011 | 365,944 |
| 2012 | 366,456 |
| 2013 | 366,969 |
| 2014 | 367,482 |
| 2015 | 367,994 |
| 2016 | 368,507 |
| 2017 | 369,019 |
| 2018 | 368,970 |
| 2019 | 368,920 |
| 2020 | 368,869 |
| 2021 | 368,819 |
| 2022 | 368,771 |
| 2023 | 368,771 |
Indicator: Deforestation and afforestationFootnote 3
Estimated area of annual deforestation in Canada by industrial sectors. Low deforestation supports high levels of biodiversity and maintains the quality of soil, air and water.
Indicator details
The National Deforestation Monitoring System (NDMS) tracks changes from forest land to other land uses across Canada. Deforestation does not include forest harvest when forests are being regrown on the site.
The NDMS can show trends by time, region and industry sector type.
Canada’s annual deforestation rate has slightly decreased over the last three decades. In 2022, 49,250 ha of forest were converted to non-forest land uses, compared to 64,000 ha in 1990.
- Canada has 9% of the world’s forest but is responsible for only 0.37% of global deforestation since 1990.
- The main drivers of deforestation in Canada continue to be agricultural, oil and gas expansion, and mining.
- The development of hydroelectric reservoirs causes noticeable spikes in annual deforestation due to the flooding of forests, as seen in 1993 and 2006.
- Deforestation in the forestry category arises from new permanent forestry roads and other persistent clearings such as sizeable landings.
- The low annual area of recorded afforestation is much smaller than the annual area of deforestation, which in turn is much smaller than the total area of Canada’s forests.
Why is this indicator important?
- Forest loss affects biodiversity, soil, air and water quality, and the availability of wildlife habitat. Forests also store more carbon than other terrestrial ecosystems and can be managed to mitigate climate change, for example, by increasing the area of forest through afforestation or by avoiding deforestation.
What is the outlook?
- The deforestation rate in Canada is expected to remain steady at its current levels.
- Ongoing and planned initiatives for planting trees in both urban and rural areas are expected to increase the afforested land area in coming years. The contribution of this activity to ecosystem services such as restoring habitat and carbon sequestration is increasingly recognized.
How government initiatives support sustainable forest management
- The federal government’s 2 Billion Trees Program is a 10-year funding program that works through partnerships in support of incremental tree planting (through both afforestation and reforestation plantings) by 2031.
Estimated area of annual deforestation in Canada, by industrial sector, 1990-2022

Graph summary
Comparison of the annual estimated area of deforestation in Canada between 1990 and 2022 by industrial sectors of:
- Agriculture
- Forestry
- Mining, oil and gas
- Built-up
- Hydroelectric
Graph data
| Year | Area deforested (hectares) | ||||
|---|---|---|---|---|---|
| Agriculture | Forestry | Mining, oil and gas | Built-up | Hydroelectric | |
| 1990 | 42,107 | 3,682 | 7,282 | 7,472 | 3,598 |
| 1991 | 38,142 | 3,600 | 7,254 | 7,298 | 6,402 |
| 1992 | 34,177 | 3,517 | 7,855 | 7,199 | 5,400 |
| 1993 | 30,217 | 3,435 | 7,952 | 7,126 | 37,323 |
| 1994 | 26,252 | 3,352 | 8,054 | 7,057 | 2,374 |
| 1995 | 22,289 | 3,270 | 8,163 | 7,028 | 1,493 |
| 1996 | 21,941 | 3,334 | 8,806 | 7,518 | 1,695 |
| 1997 | 21,597 | 3,398 | 9,146 | 7,513 | 2,014 |
| 1998 | 21,249 | 3,463 | 10,584 | 7,743 | 4,597 |
| 1999 | 20,893 | 3,527 | 11,175 | 8,354 | 6,646 |
| 2000 | 20,544 | 3,591 | 10,961 | 8,804 | 883 |
| 2001 | 20,196 | 3,655 | 10,740 | 9,104 | 882 |
| 2002 | 19,849 | 3,720 | 13,390 | 8,639 | 9,746 |
| 2003 | 19,502 | 3,784 | 13,577 | 8,951 | 3,061 |
| 2004 | 19,154 | 3,848 | 14,060 | 9,396 | 4,073 |
| 2005 | 17,982 | 3,452 | 14,758 | 8,946 | 4,035 |
| 2006 | 16,842 | 3,058 | 17,394 | 9,022 | 29,479 |
| 2007 | 15,703 | 2,666 | 17,482 | 8,657 | 3,719 |
| 2008 | 14,563 | 2,272 | 16,528 | 8,271 | 6,810 |
| 2009 | 13,422 | 1,879 | 14,037 | 8,313 | 5,072 |
| 2010 | 12,284 | 1,485 | 14,397 | 8,029 | 5,112 |
| 2011 | 14,319 | 1,540 | 15,919 | 8,231 | 2,937 |
| 2012 | 16,353 | 1,415 | 14,851 | 8,431 | 3,700 |
| 2013 | 18,390 | 1,289 | 15,444 | 9,105 | 10,776 |
| 2014 | 20,426 | 1,162 | 14,897 | 9,490 | 12,292 |
| 2015 | 22,460 | 1,032 | 15,175 | 10,025 | 8,566 |
| 2016 | 22,460 | 1,032 | 15,356 | 9,990 | 8,465 |
| 2017 | 22,460 | 1,032 | 15,184 | 9,762 | 4,175 |
| 2018 | 22,460 | 1,032 | 15,140 | 9,599 | 1,732 |
| 2019 | 22,460 | 1,032 | 14,861 | 9,579 | 2,855 |
| 2020 | 22,460 | 1,032 | 14,848 | 9,554 | 2,661 |
| 2021 | 22,460 | 1,032 | 14,760 | 9,538 | 2,733 |
| 2022 | 22,460 | 1,032 | 14,757 | 9,538 | 1,462 |
Indicator: Wood volumeFootnote 4
Long-term trends in estimated volume of wood in forests. Wood volume estimates provide information on forest productivity, available carbon storage, forest fire fuel predictions, and harvest level forecasts.
Indicator details
The National Forest Inventory (NFI) estimates that there are 50.4 billion cubic metres (m3) of wood in Canada’s forests. The provinces, territories and the Canadian Forest Service contribute data on wood volume to the NFI, which allows various national summaries of this important forest attribute, including:
- 72% of Canada’s wood volume on forest land is in coniferous forest types. The remaining is in broadleaf (14%) and mixed wood (14%) forest types.
- 50% of Canada’s wood volume is in forest stands between 61 and 120 years old. The remaining volume is in younger forests which contain less volume, and older forests, some of which have high volume and others that are sparsely treed.
How are national volume estimates improving?
Continued investments and enhancement of the NFI positions Canada to report, for the first time, wood volume trends based on statistically robust repeat pan-Canadian forest measurements.
In previous State of Canada’s Forests reports, Canada used the best available data on wood volume at a single point in time, from the NFI, together with the best available data on wood volume trends in Canada’s managed forests that were derived from the National Forest Carbon Monitoring Accounting and Reporting System, to report on overall wood volume changes between 1990 and present.
The new trend data from the NFI reveal previously unreported overall wood volume increases. This increase may be driven in part by forest area increases observed in NFI data. Given the small increase in forest area, the increase in total wood volume observed during the measurement period is minor. Forest cover increases have also been observed in studies by government and academic researchers.
Why is this indicator important?
Having a thorough understanding of how volume is distributed throughout the forest land base enables scientifically sound decision making. Canadian planners and policy analysts depend on understanding wood volume for:
- Protecting wildlife: A biologist can use wood volume as an indicator for identifying forests that are suitable habitat for species of interest. Understanding the total volume of specific species in a watershed, for example, or what percent of volume is in a specific age class may be helpful information for this task.
- Emergency planning: Wildland fires continue to impact many forests and people across the country. To keep Canadians safe, planners can make prevention and mitigation decisions if they know how dense a forest is, or how much volume of fire-prone tree species is located near a community.
- Sustainable forest management: Provincial and territorial governments set the allowable annual cut (AAC) for their jurisdictions. The AAC states how much volume can be harvested in each area and what types of species, age and tree health that volume must come from.
What is the outlook?
- Wildland fires and other natural disturbances will continue to impact wood volume across Canada’s forests. These events will increase dead tree volume, cause volume loss in some areas, shift the age class distribution as older stands are replaced by younger stands post-disturbance and alter tree species composition.
- Climate change will continue to alter how and where forest wood volume is distributed throughout Canada. Some areas may see an increase or decrease in volume due to the shift in climatic conditions.
- Wood volume can influence where Canadians live. Communities that have access to volume for products in emerging markets, such as bioenergy or mass-timber construction, may see an increase in jobs and population. Rural communities which have had their mill supply impacted by wildland fires, pests, or increases in wood supply restrictions may see a reduction in the forest sector-related jobs and population.
How government initiatives support sustainable forest management
The federal government’s Forest Systems Information and Technology Enhancement (ForSITE) program will enhance the forest information available to support forest management decision for sustainable and resilient forests and to publicly report on forest inventory and management practices.
Canadian wood volume on forest land: volume by species group
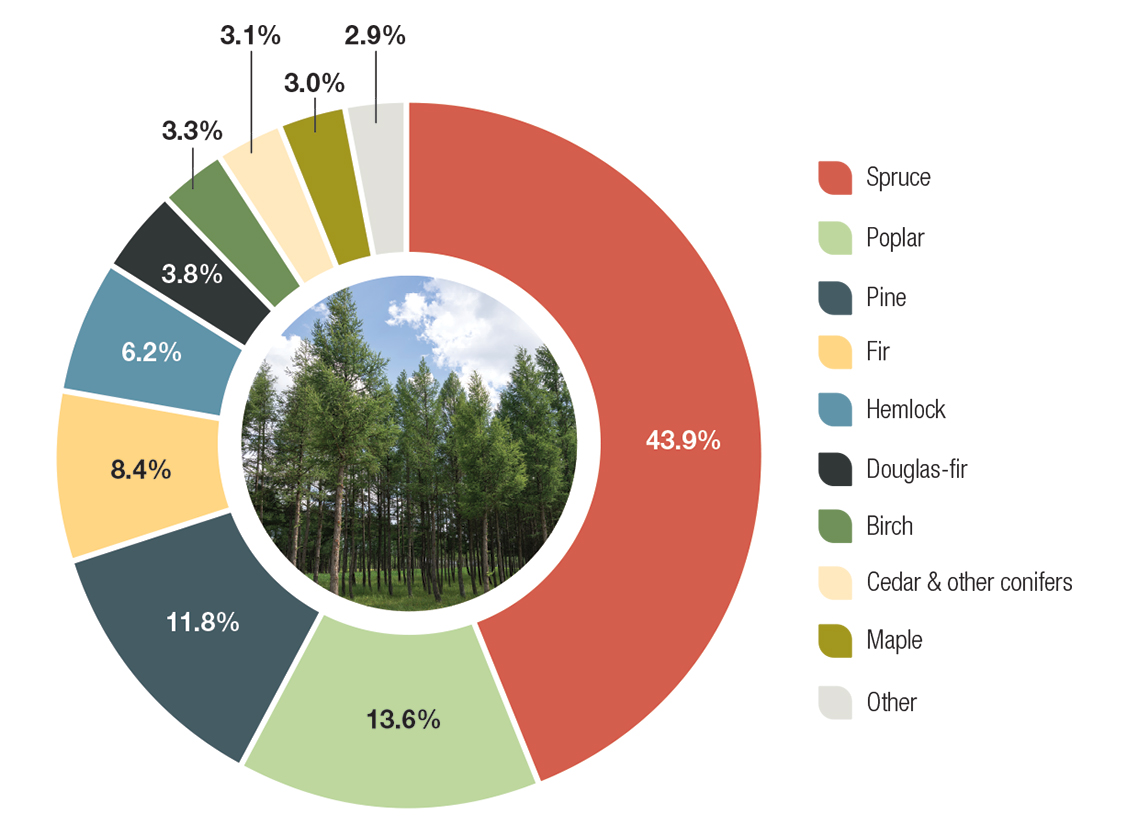
Canada’s top ten tree species groups on forest land by wood volume. Spruce and poplar, the top two, combine for over half of Canada’s wood volume.
Graph summary
Canadian wood volume on forest land: volume by species groups.
Graph data
| Species Group | Percentage (%) |
|---|---|
| Spruce | 43.9 |
| Poplar | 13.6 |
| Pine | 11.8 |
| Fir | 8.4 |
| Hemlock | 6.2 |
| Douglas-fir | 3.8 |
| Birch | 3.3 |
| Cedar & other conifers | 3.1 |
| Maple | 3.0 |
| Other | 2.9 |
Estimated wood volume (million cubic metres) in Canada
| Year | 1990 | 1995 | 2000 | 2005 | 2010 | 2015 | 2016 | 2017 | 2018 | 2019 | 2020 | 2021 | 2022 |
|---|---|---|---|---|---|---|---|---|---|---|---|---|---|
| Wood volume | 47,802 | 47,737 | 47,292 | 48,404 | 49,516 | 50,629 | 50,851 | 51,074 | 50,778 | 50,676 | 50,741 | 50,368 | 50,357 |