
Capital Expenditures Information Bulletin
(published in June 2025)
Mining is a capital-intensive industry with large-scale projects that are often valued in billions of dollars and can span multiple years.
A capital expenditureFootnote 1 (CAPEX) is money spent to buy, build or upgrade assets, such as mines, machinery and equipment, which benefit a mining company over an extended period. Because these assets contribute to sustaining or growing future mineral and metal production, information on capital spending can be a useful indicator of how industry views future market demand in relation to present supply capacity.
Find out about Canada’s minerals sector CAPEX and its spending intentions:
- Overview
- Capital expenditures in the upstream mining industry
- Capital expenditures in the metals, non-metals and coal mining subsectors
- Capital expenditures in the downstream mineral-processing industries
- Spending breakdown by province and territory
- Spending by company type
Overview
In 2024, CAPEX for Canada’s broader minerals sectorFootnote 2 fell by 4% to $22.1 billion. This decline coincided with the fall of battery and base metal prices, which was driven by global economic uncertainty, market oversupply, and a slowdown in the electric vehicle (EV) industry. Additionally, elevated inflation has pushed up the costs of materials and equipment needed to maintain and expand operations, as seen in Figure 1.
Looking ahead to 2025, CAPEX is expected to see a modest recovery, with a projected growth of 2% to $22.7 billion. This slight rebound is mainly due to planned investments in potash and copper-zinc mining.
Trends in minerals sector CAPEX are primarily influenced by the upstream mining industry, the most capital-intensive segment of the sector. As demand for critical minerals rises to support the clean energy transition, suppliers will need to invest significantly to scale up production. However, anticipated supply shortages could drive mineral and metal prices higher.
Figure 1: Capital expenditures in the minerals sector and inflation, 2006 to 2024
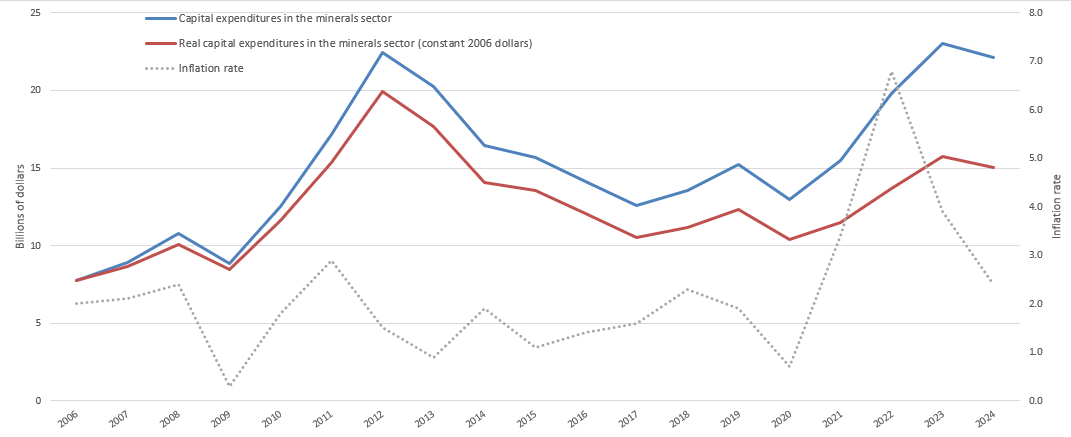
Text version — Figure 1
This line graph shows the trend in CAPEX in the minerals sector in constant and current dollars in relation to the evolution of the inflation rate. The graph illustrates the impact of inflation on CAPEX.
Sources: Natural Resources Canada, Statistics Canada
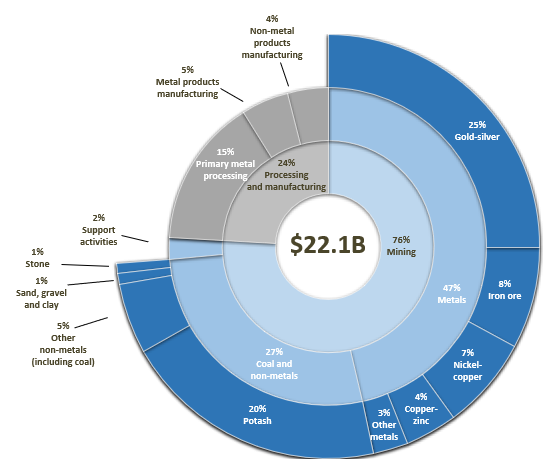
Figure 2: Minerals sector capital expenditures, by subsector, 2024 (p)
Text version — Figure 2
| Sector | Value |
|---|---|
| Mining | 16,319.9 |
| Metals | 10,299.8 |
| Gold-silver | 5,551.9 |
| Iron ore | 1,707.3 |
| Nickel-copper | 1,571.3 |
| Copper-zinc | 884.9 |
| Other metals | NA |
| Coal and non-metals | 6,020.0 |
| Potash | 4,477.7 |
| Other non-metals (including coal) | NA |
| Sand, gravel and clay | 181.2 |
| Stone | 179.9 |
| Support activities | 477.0 |
| Processing and manufacturing | 5,330.9 |
| Primary metal processing | 3,350.8 |
| Metal products manufacturing | 1,071.0 |
| Non-metal products manufacturing | 909.1 |
| Minerals sector | 22,127.7 |
Sources: Natural Resources Canada, Statistics Canada
B = billion, p = preliminary expenditures
Capital expenditures in the upstream mining industry
In 2024, CAPEX in Canada’s mining and quarrying (excluding oil and gas)Footnote 2 industry declined by 4% to $16.3 billion. However, spending intentions for 2025 suggest a slight recovery, with anticipated CAPEX rising by 1% to $16.5 billion.
Mineral and metal prices are key indicators of market demand and supply, and they play a major role in shaping CAPEX decisions in the mining industry, as shown in Figure 3.
When market conditions are weak and financing is limited, companies typically focus on preserving capital. In contrast, when demand and price outlooks improve, firms are more likely to ramp up investment, aiming to expand production capacity and take advantage of opportunities to boost cash flow and profitability.
Figure 3. Minerals sector capital expenditures, by subsector, and metals and minerals price index, 2015 to 2025
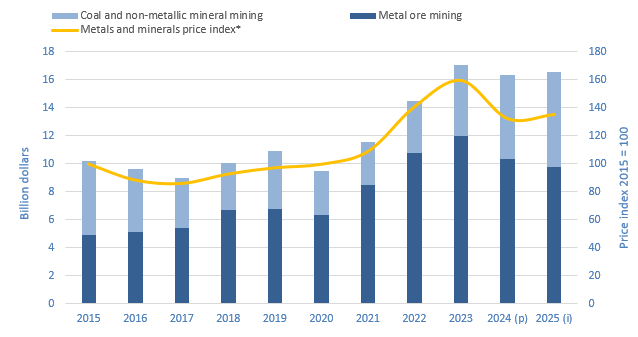
Text version — Figure 3
| Year | Metal ore mining | Coal and non-metallic mineral mining | Metals and minerals price index (2015 = 100)* |
|---|---|---|---|
| 2015 | 4.9 | 5.3 | 100 |
| 2016 | 5.1 | 4.5 | 88.6 |
| 2017 | 5.4 | 3.6 | 86.2 |
| 2018 | 6.7 | 3.3 | 92.9 |
| 2019 | 6.8 | 4.1 | 97.3 |
| 2020 | 6.3 | 3.1 | 99.8 |
| 2021 | 8.5 | 3.0 | 108.9 |
| 2022 | 10.8 | 3.7 | 140.6 |
| 2023 | 12.0 | 5.1 | 159.0 |
| 2024 (p) | 10.3 | 6.0 | 131.9 |
| 2025 (i) | 9.8 | 6.7 | 135.0 |
Sources: Natural Resources Canada, Bank of Canada, Statistics Canada
p = preliminary expenditures, i = spending intentions.
*The metals and minerals price index is presented with a one-year lag.
Since peaking at the beginning of the last decade, capital spending in the mining industry has generally trended downward, hitting a 10-year low of $9.0 billion in 2017. Investment rebounded over the following two years but declined again in 2020 due to the impacts of the COVID-19 pandemic.
Since 2021, however, CAPEX in the mining sector has returned to its pre-pandemic growth trajectory – though this recovery has been partially driven by rising inflation, which has increased the cost of materials and equipment.
CAPEX was relatively flat for a period following a peak at the start of the previous decade that was driven by strong demand in China and other emerging economies. As supply caught up with demand, mineral and metal prices began to fall, leading to a decline in investment. After 2016, commodity prices started to rise again – though more gradually – and CAPEX increased accordingly until 2019.
In 2020, the onset of the COVID-19 pandemic caused a sharp drop in mineral and metal prices due to reduced global consumption resulting from lockdowns and other containment measures. Prices later rebounded, surpassing pre-pandemic levels as demand recovered, particularly in China, while supply remained constrained in many regions.
In early 2022, the prices of several metals surged to record highs following Russia’s invasion of Ukraine. Russia’s significant role in global metal production and trade, combined with supply chain disruptions, sanctions, and retaliatory measures, drove up the prices of commodities such as palladium, nickel, aluminum, and potash. However, prices have since declined – especially for nickel and lithium – amid tighter financing conditions, a surge in global supply and easing momentum of EV adoption in some regions. That said, the clean energy transition is expected to maintain strong demand for critical minerals.
Natural Resources Canada’s Major Projects Inventory lists 138 major planned or proposed mining-related projects over the next 10 years (2024–34) across Canada. These projects – including mine constructions, redevelopments, expansions, and processing facilities – represent a potential investment of $117.1 billion.
Learn about major natural resource projects currently under construction or planned within the next 10 years.
Capital expenditures in the metals, non-metals and coal mining subsectors
In 2024, CAPEX within the metal mining subsector saw a 14% decrease to $10.3 billion, with varied outcomes across individual metals, as displayed in Figure 4.
Spending intentions for 2025 indicate a further 5% decrease to $9.8 billion.
- Nickel-copper ore mining, iron ore mining, and gold and silver ore mining are expected to decrease by 22%, 17%, and 16%, respectively.
- Copper-zinc ore mining, which has been included in “All others” in Figure 4 due to 2023 data suppression, is anticipated to increase by 113%.
Figure 4. Capital expenditures in metals mining subsector, 2023 to 2025
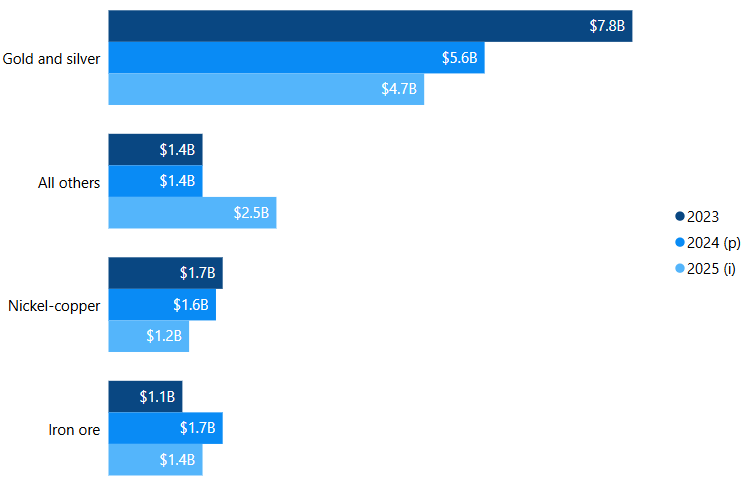
Text version — Figure 4
In 2024, gold and silver ore mining, which accounted for 54% of this subsector’s CAPEX, experienced a sharp 28% decline to $5.6 billion. Nickel-copper ore mining, which represented 15% of the subsector’s CAPEX, saw an 8% decrease to $1.6 billion. In contrast, iron ore mining (17%) recorded a significant 63% increase to $1.7 billion. Copper-zinc ore mining accounted for 9% of the subsector’s CAPEX, with its share of these expenditures totalling $885 million; however, the 2023 value is not available for comparison.
Sources: Natural Resources Canada, Statistics Canada
p = preliminary expenditures, i = spending intentions
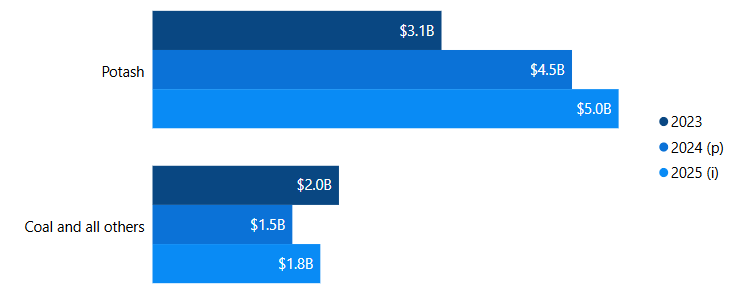
In 2024, CAPEX within the coal and non-metals mining subsectors rose significantly, increasing by 18% to $6.0 billion. This increase was primarily driven by strong investment in potash mining.
- Potash mining, which comprised 75% of the subsector’s CAPEX in 2024, experienced a remarkable surge of 45% to $4.5 billion. Notably, in 2021, the BHP mining company greenlit the $7.5 billion Jansen Stage 1 potash project in Saskatchewan, with production anticipated to start in late 2026.
- In contrast, coal and all other non-metals mining declined by 25%, falling to $1.5 billion in 2024, but is expected to rebound by 20% to $1.8 billion in 2025.
Overall, CAPEX in the coal and non-metals mining subsectors is expected to rise by 12% in 2025, reaching $6.7 billion, once again due to growth in potash mining, which is projected to increase by 11% to $5.0 billion. Canada remains the world’s leading producer of potash.
Figure 5: Capital expenditures in coal and non-metals mining subsectors, 2023 to 2025
Text version — Figure 5
The image is a horizontal bar chart showing CAPEX in Canada’s mining sector for two categories, Potash and Coal and all others, across three years – 2023, 2024 (preliminary expenditures), and 2025 (spending intentions).
- Potash
- 2023: $3.1 billion (dark blue bar)
- 2024 (projected): $4.5 billion (blue bar)
- 2025 (intentions): $5.0 billion (light blue bar)
- Coal and all others
- 2023: $2.0 billion (dark blue bar)
- 2024 (projected): $1.5 billion (blue bar)
- 2025 (intentions): $1.8 billion (light blue bar)
Sources: Natural Resources Canada, Statistics Canada
p = preliminary expenditures, i = spending intentions
Capital expenditures in the downstream mineral-processing industries
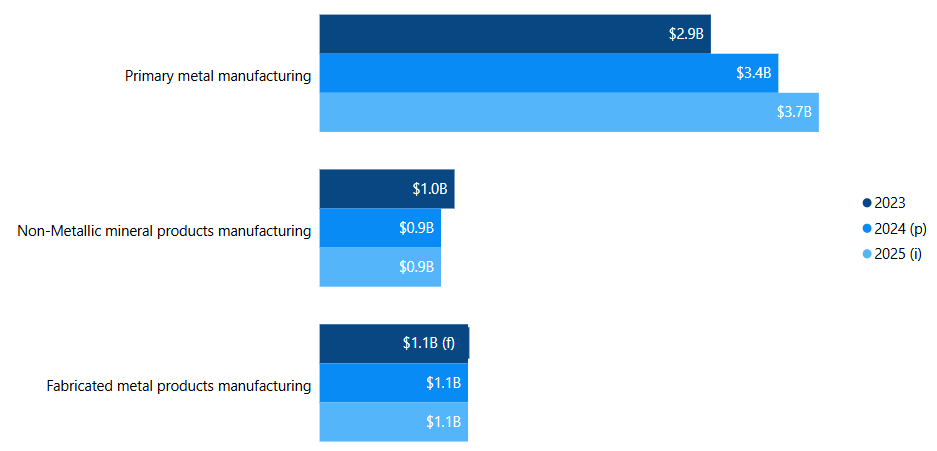
In 2024, CAPEX within Canada’s downstream mineral-processing industriesFootnote 2 rose by 1% to $5.3 billion.
CAPEX in the primary metal manufacturing industry, which accounted for 63% of this subsector’s CAPEX in 2024, increased by 16% to reach $3.4 billion. This segment includes facilities primarily involved in smelting and refining both ferrous and non-ferrous metals, such as aluminum, copper, nickel, and gold.
Fabricated metal products manufacturing industry CAPEX held constant, while CAPEX in the non-metal products manufacturing industry declined by 11% to $909 million. These industries include establishments primarily engaged in processes such as forging, stamping, forming, turning, and joining to produce ferrous and non-ferrous metal products.
Spending intentions for 2025 in the downstream mineral-processing industries point to a 7% increase in CAPEX, reaching $5.6 billion. This overall growth is driven by anticipated gains in one of the three industries of the subsector: a 9% increase in primary metal manufacturing.
Figure 6: Capital expenditures in downstream mineral-processing industries, 2023 to 2025
Text version — Figure 6
Primary metal manufacturing, which constituted 63% of this subsector’s CAPEX in 2024, increased by 16% to $3.4 billion. Fabricated metal products manufacturing held constant at $1.1 billion, and non-metal products manufacturing decreased by 11% to $909 million.
Sources: Natural Resources Canada, Statistics Canada
The 2023 value for fabricated metals products manufacturing was estimated by Natural Resources Canada.
B = billion, p = preliminary expenditures, i = spending intentions, f = unreliable
Spending breakdown by province and territory
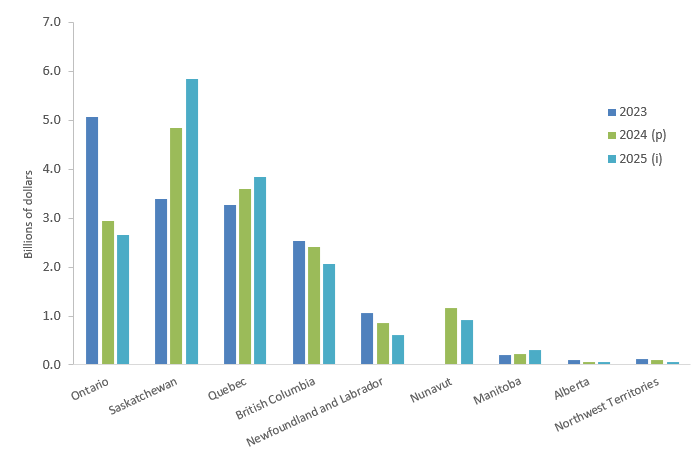
CAPEX across Canada’s provinces and territories, as shown in Figure 7, can vary significantly from year to year, largely depending on the number and stage of active or developing mines. Jurisdictions with fewer mines tend to see greater volatility, as the construction of a single project can represent a large share of total spending.
CAPEX is heavily concentrated in a few of Canada’s major mining jurisdictionsFootnote 3. In 2024, Saskatchewan (30%), Quebec (22%), and Ontario (18%) accounted for 70% of total mining industry CAPEX. Saskatchewan’s elevated share reflects its dominant position in potash production, as all of Canada’s potash mines are located in the province.
Year-over-year changes in mining CAPEX across provinces and territories in 2024 were mostly positive. Saskatchewan and Quebec recorded significant increases of 43% and 10%, respectively. In contrast, Newfoundland and Labrador and Ontario experienced declines of 19% and 10%, respectively. Comparative data for the remaining provinces and territories was not available.
Figure 7: Mining industry capital expenditures, by jurisdiction (subject to data availability), 2023 to 2025
Text version — Figure 7
| Province / Territory | 2023 | 2024 (p) | 2025 (i) |
|---|---|---|---|
| Newfoundland and Labrador | 1,062.2 | 862.6 | 615.8 |
| Prince Edward Island | x | x | x |
| Nova Scotia | x | x | 27.5 |
| New Brunswick | x | 30.4 | 25.2 |
| Quebec | 3,277.8 | 3,592.4 | 3,840.3 |
| Ontario | 5,067.6 | 2,933.4 | 2,660.1 |
| Manitoba | 208.4 | 222.5 | 308.1 |
| Saskatchewan | 3,389.7 | 4,842.3 | 5,843.5 |
| Alberta | 103.6 | 54.0 | 62.7 |
| British Columbia | 2,538.8 | 2,406.2 | 2,061.0 |
| Yukon | x | x | x |
| Northwest Territories | 127.8 | 106.9 | 57.4 |
| Nunavut | x | 1,166.2 | 923.0 |
Sources: Natural Resources Canada, Statistics Canada
p = preliminary expenditures, i = spending intentions, x = confidential, F = unreliable
Spending intentions for 2025 show a mixed outlook across provinces and territories. Several jurisdictions are planning to increase CAPEX, with significant gains anticipated in Manitoba (+38%), Saskatchewan (+21%), Alberta (+16%), and Quebec (+7%). In contrast, other jurisdictions are projecting declines in CAPEX, including Ontario (-9%), Nunavut (-14%), British Columbia (-29%), and Newfoundland and Labrador (-29%).
Spending by company type
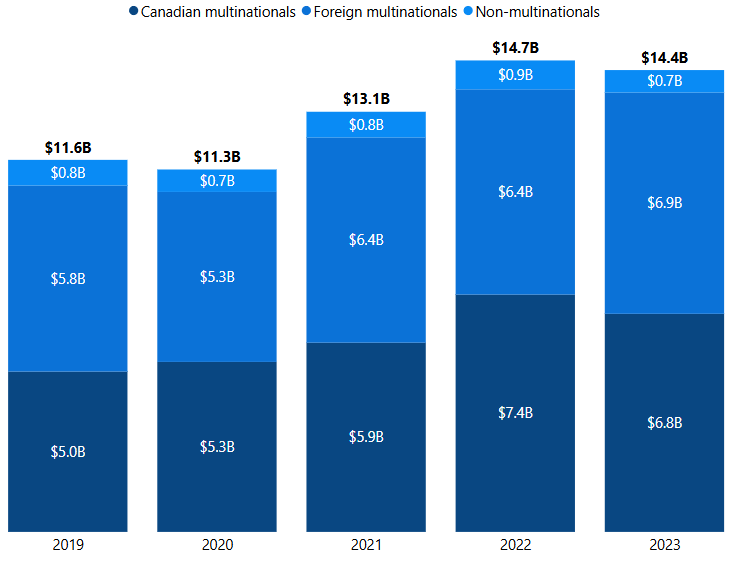
CAPEX in Canada’s mining sector is nearly evenly split between foreign and domestic owned companies. In 2023, foreign multinational enterprises (MNEs) – companies operating in Canada but controlled by foreign owners – accounted for 48% of total capital investment. Canadian MNEs – domestically controlled firms with international operations – contributed 47%, while the remaining 5% came from non-MNEs – Canadian companies without foreign operations.
These figures are drawn from Statistics Canada’s data on gross fixed capital formation, which measures investment in long-lived physical assets (such as construction, machinery, and equipment) and intellectual property, including mineral explorationFootnote 4. Although often referred to as capital investment, this dataset is distinct from others previously referenced.
Figure 8: Gross fixed capital formation in mining sector, 2019 to 2023
Text version — Figure 8
Of the $6.8 billion invested by Canadian MNEs in 2023, $4.6 billion (68%) was allocated to construction, $1.5 billion (22%) to machinery and equipment, and $616 million (10%) to intellectual property, including exploration. A similar expenditure pattern was observed for foreign MNEs, with $4.3 billion (62%) of the $6.9 billion invested directed towards construction, $1.4 billion (20%) towards machinery and equipment, and $1.1 billion (16%) towards intellectual property.
Sources: Natural Resources Canada, Statistics Canada
B = billion